EarningsNYSE:HPQ
HP shares slide 9.0%, wiping out $2.5 billion after PC shipments sink 16%
PALO ALTO, California, August 26, 2026, 17:03 — HP Inc's stock dropped 9.0%, erasing $2.5 billion in market value, after the company reported a…
Market intelligence
Fast, evidence-led coverage of the companies and events moving global markets.
All coverage
PALO ALTO, California, August 26, 2026, 17:03 — HP Inc's stock dropped 9.0%, erasing $2.5 billion in market value, after the company reported a…
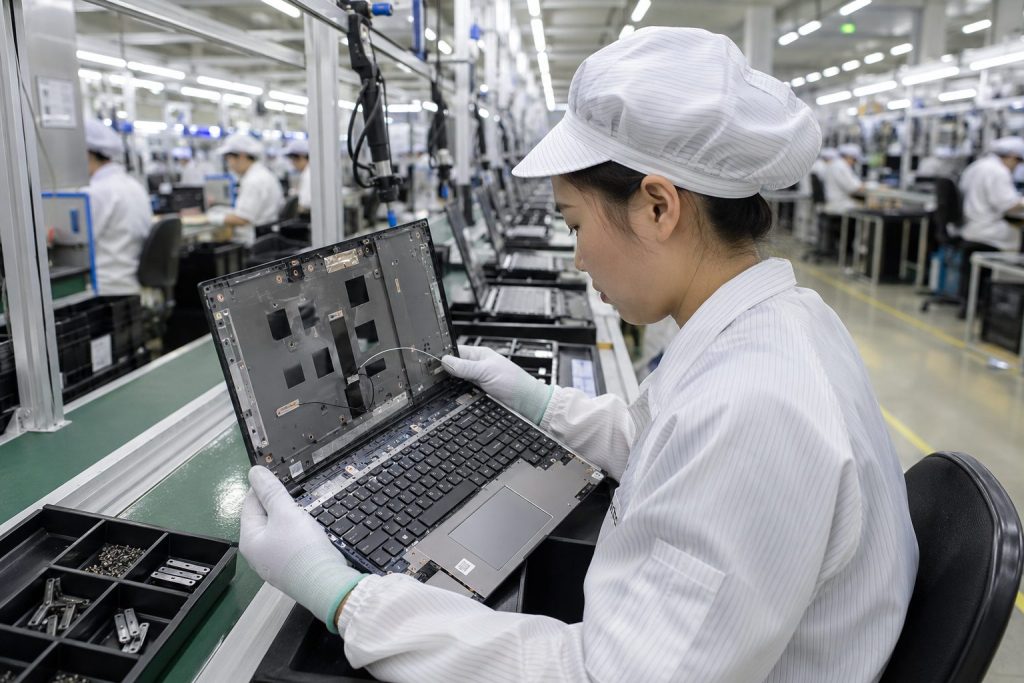
The divergence matters. A simple revenue-to-units calculation implies roughly 40% higher Personal Systems revenue per unit. Pricing and premium mix did the heavy lifting while underlying unit demand contracted.
Regular close: 16:00:02 EDT. After-hours quote: 17:02:21 EDT.
| Metric | Result / guide | Reference |
|---|---|---|
| Q3 revenue | $15.68B | $14.44B est. |
| Q3 adjusted EPS | $0.83 | $0.66 est. |
| Q3 net income | $661M | $763M year ago |
| FY adjusted EPS | $3.19–$3.29 | $2.90–$3.10 prior |
| FY free cash flow | $3.0–$3.2B | $2.8–$3.0B prior |
| Q4 adjusted EPS | $0.69–$0.79 | $0.67 consensus |
Printing’s 2% decline is important because the segment has carried far higher margins. In fiscal Q2, Personal Systems margin was 5.2%; Printing margin was 18.3%.
| Company | Aug. 26 close | Session move | Market cap | P/E |
|---|---|---|---|---|
| HP (HPQ) | $30.52 | +3.39% | $28.23B | 11.3× |
| Dell (DELL) | $463.82 | +2.77% | $304.27B | 37.0× |
| Apple (AAPL) | $313.45 | +1.16% | $4.61T | 36.0× |
| Logitech (LOGI) | $100.19 | +1.56% | $14.53B | 18.4× |
HP’s lower multiple prices in a structurally weaker mix and limited unit growth. At the $27.77 after-hours price, the $23.41 one-year analyst target implied 15.7% downside. The $3.1 billion free-cash-flow midpoint equaled roughly 12% of implied after-hours equity value.
Peer prices and valuation snapshot: August 26, 2026, approximately 16:45–16:50 EDT. HP after-hours valuation is an estimate using the closing share count.
Demand: Higher prices may suppress replacement units.
Margins: Memory inflation may arrive before pricing catches up.
Mix: PC growth has lower margins than Printing.
Quality: Tariff refunds are nonrecurring.
Sentiment: The analyst target remains below the traded price.
HP fiscal Q3 earnings call — August 26, 2026, 17:30 EDT. The market needs a bridge from strong revenue to sustainable unit growth and margins. Guidance on memory supply, pricing, Printing and refund-adjusted earnings will set the next move.
Sources: Reuters · The Wall Street Journal · Yahoo Finance · HP investor relations
SAN FRANCISCO, August 26, 2026, 16:49 EDT — Okta's stock climbed 15.7%, boosting its market capitalization by $3.5 billion as the company reported an…
The market added almost four times the raised full-year free-cash-flow midpoint. Sustained backlog conversion is now the central valuation test.
| Metric | Prior midpoint | New midpoint | Change |
|---|---|---|---|
| Revenue | $3.195B | $3.221B | +$26M |
| Adjusted operating income | $816M | $835M | +$19M |
| Adjusted EPS | $3.83 | $3.92 | +$0.09 |
| Free cash flow | $870M | $920M | +$50M |
| Ratings | 46 |
| Buy / Overweight / Hold | 29 / 6 / 9 |
| Underweight / Sell | 2 / 0 |
| Average target | $147.18 · 5.3% below |
| Median target | $161 · 3.6% upside |
| Target range | $75–$180 |
Analyst recommendations and targets as of the August 26, 2026 close.
Salesforce, Inc. stock surged 12.73% in postmarket trading on Wednesday. The gain came after fiscal second-quarter results reinforced the company's AI-driven growth outlook.
Salesforce added an implied $22.8 billion of equity value after hours. The cleaner operating signal was $3.37 adjusted EPS excluding investment gains, while Agentforce and Data 360 ARR approached $3.9 billion.
The equity-value gain was about 114 times the $200 million increase in the fiscal-year revenue-guidance midpoint.
| Metric | Reported / guided | Benchmark | Signal |
|---|---|---|---|
| Q2 revenue | $11.35B | $11.33B consensus | Small beat |
| Adjusted EPS | $5.90 | $3.27 consensus | Investment gains amplified it |
| EPS ex investment gains | $3.37 | $3.27 consensus | 3.1% beat |
| Q3 revenue | $11.42B–$11.50B | New guidance | Steady double-digit scale |
| Q3 adjusted EPS | $3.42–$3.44 | New guidance | Operating leverage |
| FY27 revenue | $46.1B–$46.4B | Prior $45.9B–$46.2B | Midpoint +$200M |
| FY27 adjusted EPS | $16.67–$16.71 | Prior $14.06–$14.12 | Midpoint +18.5% |
| Implied market cap / trailing revenue | 4.7× |
| Implied market cap / FY27 revenue midpoint | 4.4× |
| Implied P/E using trailing EPS | 26.8× |
| Levered free-cash-flow yield | 8.2% |
| Average analyst target | $243.98 · 5.3% upside |
| Citizens target | $315 · 35.9% upside |
| 52-week range | $146.32–$269.11 |
| Estimated YTD after the move | about −12% |
Valuation ratios use the $231.80 after-hours price and latest trailing figures available at 16:37 EDT.
| Company | Ticker | Close | Move |
|---|---|---|---|
| Salesforce | CRM | $205.62 | −0.03% regular / +12.73% AH |
| ServiceNow | NOW | $125.80 | −0.94% |
| Adobe | ADBE | $273.47 | −0.16% |
| Snowflake | SNOW | $315.37 | −0.52% |
Peer prices are the August 26 regular-session closes; Salesforce’s earnings move occurred afterward.
The positive read: AI and data ARR nearing $4 billion gives investors a measurable commercial bridge. The strongest net-new annual order growth in four years suggests the signal reaches beyond pilot activity.
The test: The $22.8 billion revaluation needs organic cRPO growth and repeatable Agentforce bookings. A $200 million revenue-guide lift alone does not explain it.
Risks: Strategic-investment gains may reverse. Informatica and pending acquisitions blur organic growth. Customer deployments can remain slow where data is fragmented.
Next catalyst: the 17:00 EDT earnings call. Watch Agentforce bookings, organic growth, free cash flow, acquisition assumptions and any change to capital returns.
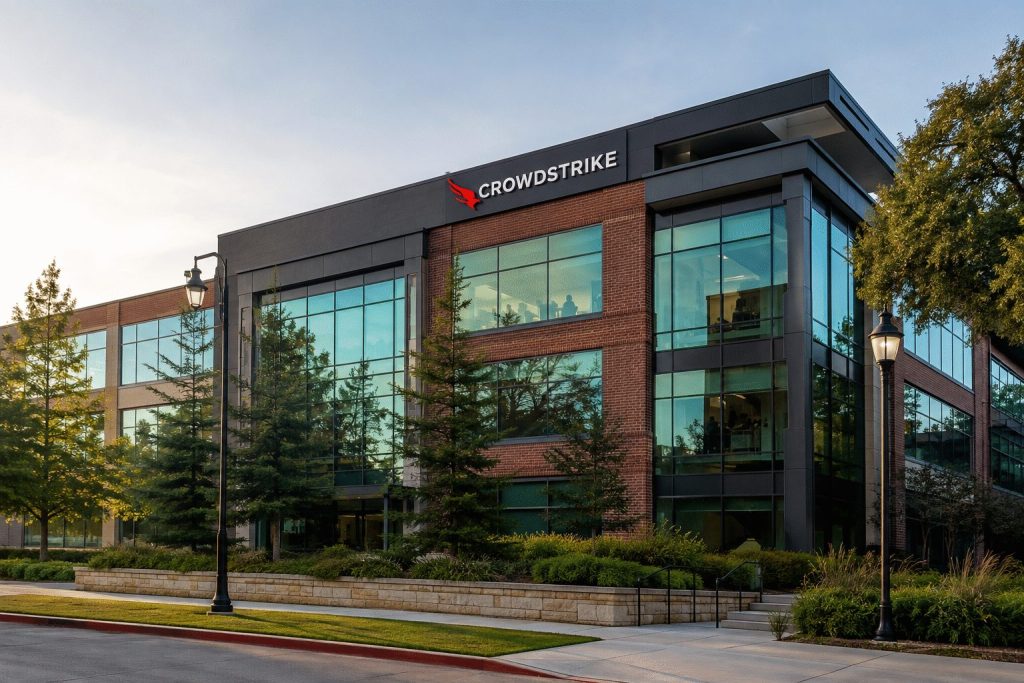
AUSTIN, Texas, August 26, 2026, 16:40 EDT — CrowdStrike stock climbed 10.9%, increasing its market capitalisation by $21 billion after the company reported an…
As of August 26, 2026, 16:40 EDT. After-hours quote; financial data covers fiscal Q2 ended July 31, 2026.
| Fiscal 2027 | Previous | Current |
|---|---|---|
| Revenue midpoint | $5.937B | $6.001B |
| Ending ARR midpoint | $6.544B | $6.607B |
| Net new ARR growth | 27.7% | 34.0% |
| Adjusted EPS | $1.21–$1.24 | $1.25–$1.26 |
SANTA CLARA, California, August 26, 2026, 16:30 EDT — Nvidia stock declined by 1.8% after reporting quarterly revenue of $96.2 billion, as the company’s…
| Measure | Value | Signal |
|---|---|---|
| Adjusted EPS | $2.22 | +6.2% vs est. |
| Q2 gross margin | 75.0% | Flat QoQ |
| Q3 gross margin | 74.0% | -1.0 pt |
| Free cash flow | $21.34B | -56% QoQ |
| DSO | 60 days | +15 days |
| Metric | Q2 FY27 | Sequential | Why it matters |
|---|---|---|---|
| Data Center | $89.0B | +18% | Core demand remains strong |
| ACIE | $40.3B | +25% | Faster than hyperscale |
| Receivables | $63.1B | DSO 45→60 | Cash conversion slowed |
| Inventory | $31.6B | +22% | Rubin launch build |
| Operating cash flow | $24.1B | -52% | Working capital and taxes |
Bull: $108B revenue converts to cashBull: ACIE sustains 25% QoQ growthBear: margin falls below 73.5%Bear: DSO extends againBear: customer guarantees activate
Commitments are future obligations, not immediate debt. Guarantees are contingent. The valuation test is whether Nvidia's revenue and free cash flow scale faster than supply, lease and customer-support exposure.
ATLANTA, August 26, 2026, 15:48 – Volato surged 62% following an announcement of a $500 million artificial intelligence merger, vastly outstripping the company's $13…
| Measure | Latest | Read-through |
|---|---|---|
| Q2 revenue | $0.965m | Small operating base |
| Q2 operating loss | $2.52m | Loss exceeds revenue |
| Cash | $8.44m | 30 Jun 2026 |
| Working capital | ~$0.9m | Limited cushion |
| H1 financing cash | $7.0m | Mostly equity issuance |
| Employees | 13 | Major operating pivot |
Prior equity use makes the new preferred-stock conversion terms the central per-share variable.
Generate Biomedicines Inc. shares fell 20.3% to $16.25 at 15:06 EDT. The decline erased about $530 million of quoted equity value.
Information gain: the day’s $4.13 decline erased roughly $530 million of quoted equity value. The unlocked block itself was worth about $1.68 billion at $16.25.
GENB rose 26.4% from Aug. 21 through Aug. 25, then gave back nearly the entire advance. It remained 1.6% above the $16 IPO price at 15:06 EDT on Aug. 26.
| Metric | Latest | Investor read |
|---|---|---|
| Cash + securities | $457.4M | 21.9% of market cap |
| H1 operating cash use | $138.3M | Runway into H1 2028 |
| Q2 collaboration revenue | $6.3M | −37.7% year over year |
| Q2 net loss | $67.3M | Widened from $56.7M |
| Q2 GB-0895 external R&D | $20.5M | +54.3% year over year |
What changes next: ownership supply drove this session. September data can shift the focus back to GB-0895’s pharmacology and the twice-yearly dosing case.
As of Aug. 26, 2026. Morgan Stanley reiterated Buy with a $22 target on Aug. 17; Piper Sandler reiterated Buy with a $24 target on Aug. 7.
Bull case: little actual lock-up selling would make the 20% drop look like a temporary supply discount. Positive COPD data could strengthen the six-month dosing proposition ahead of larger severe-asthma readouts.
Risk case: sustained insider or venture-holder sales could cap rebounds. Weak September pharmacology, faster cash use, or Phase 3 delays would raise financing and dilution risk before commercialization.
WARSAW, August 26, 2026, 21:10 CEST — Shares in Snap Inc. dropped 7.94% to $5.45 on Wednesday afternoon as a youth-safety lawsuit in Pennsylvania…
Pennsylvania teen-safety lawsuit
Pennsylvania sued Snap under its consumer-protection law, alleging deceptive safety and age-rating claims and an addictive, high-risk design for minors. These are allegations, not findings; the complaint specifies no dollar liability.
Market snapshot: Aug. 26, 2026, 2:47:31 p.m. EDT · latest trade in delayed consolidated feed · retrieval 3:02:58 p.m. EDT
SNAP underperformed META by 9.80 percentage points and PINS by 6.88 points at the same snapshot. That comparison supports a stock-specific repricing; it does not prove the lawsuit caused every part of the move.
Reuters reported that Meta separately agreed to pay up to $18 billion and make youth-safety product changes. Snap is not a party to that settlement, but its scale supplies a same-day industry benchmark for legal and product-remedy risk.
Philadelphia Court of Common Pleas · Pennsylvania Unfair Trade Practices and Consumer Protection Law (UTPCPL)
The near-term issue is remedy uncertainty. An injunction could matter through product design, marketing, compliance cost or engagement—not only through a cash penalty.
Risk transmission, not a forecast. Snap’s Aug. 4 10-Q—filed before this Pennsylvania case—already said youth-harm litigation outcomes were uncertain and that it could not estimate a reasonably possible loss range for those matters.
| Metric | Q2 2026 | Q2 2025 | YoY |
|---|---|---|---|
| Revenue | $1.599B | $1.345B | +19% |
| Advertising revenue | $1.283B | $1.174B | +9% |
| Other revenue | $316M | $171M | +85% |
| Adjusted EBITDA | $250M | $41M | +505% |
| Net loss | $(164)M | $(263)M | 38% narrower |
| Free cash flow | $121M | $24M | +407% |
| Average DAU | 493M | 469M | +5% |
| Global ARPU | $3.25 | $2.87 | +13% |
Exact reported figures were $1,598.993M revenue, $249.615M adjusted EBITDA, $(163.960)M net loss and $120.538M FCF. Adjusted EBITDA and FCF are non-GAAP measures.
Ad mix fell from 87.3% a year earlier; subscription-led other revenue rose to 19.8%.
The Q3 revenue range implies roughly 12.8%–15.5% growth versus Q3 2025, derived from $1.5068B.
Consensus is an aggregate, not company guidance, and can change after legal or operating developments.
Derived using the Aug. 26 intraday market value and June 30 balance sheet: $2.660B cash/securities and $3.535B debt. Snap reported 1.691B shares outstanding across all three classes as of July 30; vendors can use different share-count conventions. These are mixed-date approximations.
The $11 spread between low and high targets signals unusually broad model uncertainty. Targets are opinions, not promised outcomes.
A quantified penalty, injunction request, adverse preliminary ruling or settlement term would replace today’s open-ended exposure with a more modelable cost or product constraint.
Snap’s June 30 filing said the next two California JCCP youth-harm bellwether trials involving Snap were scheduled for October. Trial timing or resolution can reset risk expectations.
Revenue inside the $1.70B–$1.74B guide and adjusted EBITDA inside $300M–$350M would test whether Q2’s ad recovery and direct-revenue growth persist through the legal noise.
Expion Energy Inc. shares surged 60.53% on Wednesday. The battery producer is funding a significant move toward Louisiana gas exploration.
| Layer | Potential shares |
|---|---|
| Current common | 0.962M |
| Series A-1 conversion | 2.117M |
| Five-year warrants | 2.117M |
| Scenario total | 5.196M |
Mitsubishi Motors is set to debut the 2027 Pajero on September 2. The flagship SUV makes a comeback to international markets after a five-year…
Flagship SUV return meets a low-margin growth plan.
Market data: August 26, 2026, 15:30 JST · Dashboard: August 27, 2026, 03:42 JST
Equity-value change uses the ¥9.20 share gain and 1.34 billion shares outstanding.
| Signal | Verified measure |
|---|---|
| Global return | After 5 years |
| Lifetime sales | >3.25M units |
| Historical markets | >170 |
| Dakar record | 12 wins |
| Platform | Triton ladder frame |
| Drive control | S-AWC |
Lifetime Pajero sales equal 3.8 times Mitsubishi's current full-year volume target.
Reveal date and triple multi meter confirmed.
Pricing, powertrain and initial markets are key.
Management links Pajero to sales growth.
857,000 retail units and 2.8% margin.
Sources: Mitsubishi Motors official Pajero site and releases; Mitsubishi Motors Q1 presentation summary; StockAnalysis and Investing.com market and consensus data. Currency is Japanese yen. Estimates are explicitly marked.
Shares of Biohaven jumped on Wednesday after a federal court finalized its win in a trade-secret lawsuit, boosting the clinical-stage drugmaker’s market capitalization by…
The market-value response was about 138× the total award. Investors treated the judgment as platform validation, not income.
| Metric | Latest |
|---|---|
| Cash, securities and restricted cash | $270.5M |
| Q2 R&D expense | $100.8M |
| Q2 net loss | $137.3M |
| H1 operating cash use | $235.0M |
| Revenue | None |
Company guidance says existing resources fund at least one year. Further capital is still expected before meaningful product revenue.
| Program | Target / disease | Reported signal | Stage |
|---|---|---|---|
| BHV-1300 | Pathogenic IgG / Graves’ | >80% mean antibody reduction at week 12 | Phase 3 |
| BHV-1400 | Gd-IgA1 / IgAN | ~70% reduction within first month | Pivotal start planned |
These are early biomarker findings. They do not establish clinical benefit or approval.
Legal: RA Capital has denied wrongdoing and signaled post-trial and appellate remedies plus patent counterclaims.
Clinical: The stock’s value depends on pivotal outcomes, safety, enrollment and regulatory review.
Financing: Pre-revenue cash use keeps dilution and debt terms material.
India's family-SUV market gets two hybrid options with MG's Hector Tomahawk. The brand's battery-rental scheme further shifts car ownership costs towards a subscription model.
| Metric | EV | PHEV |
|---|---|---|
| Battery | 69.2kWh | 20.5kWh |
| Electric range | 517km | 115km |
| Combined range | — | 1,100km+ |
| BaaS rental | ₹4.90/km | ₹3.20/km |
| Delivery start | September | November |
EV BaaS cuts entry cost 28.2%; PHEV BaaS cuts it 15.2%. At 10,000km per year, rentals add ₹49,000 and ₹32,000.
| JSW MG 2025 sales | 70,500 vehicles |
| Growth vs. 2024 | +15.6% |
| Current annual capacity | 120,000 |
| Planned annual capacity | 300,000 |
| Planned investment | $330m–$440m |
| FY2025 venture loss | $121m |
| Close / daily move | CN¥10.39 / +0.78% |
| Volume | 32.57m shares |
| Market value | CN¥117.79bn |
| Trailing revenue | CN¥655.8bn |
| Trailing net income | CN¥10.11bn |
| Trailing P/E | 11.6× |
| Next earnings date | Aug. 29, 2026 |
| Checkpoint | Timing | Signal |
|---|---|---|
| EV registrations | September | Search interest converting into paid deliveries |
| PHEV handovers | November | Demand for long-range hybrid packaging |
| Localization | 2026–2027 | Lower FX and freight exposure |
| Capacity ramp | Multi-year | Utilization against 300,000-unit target |
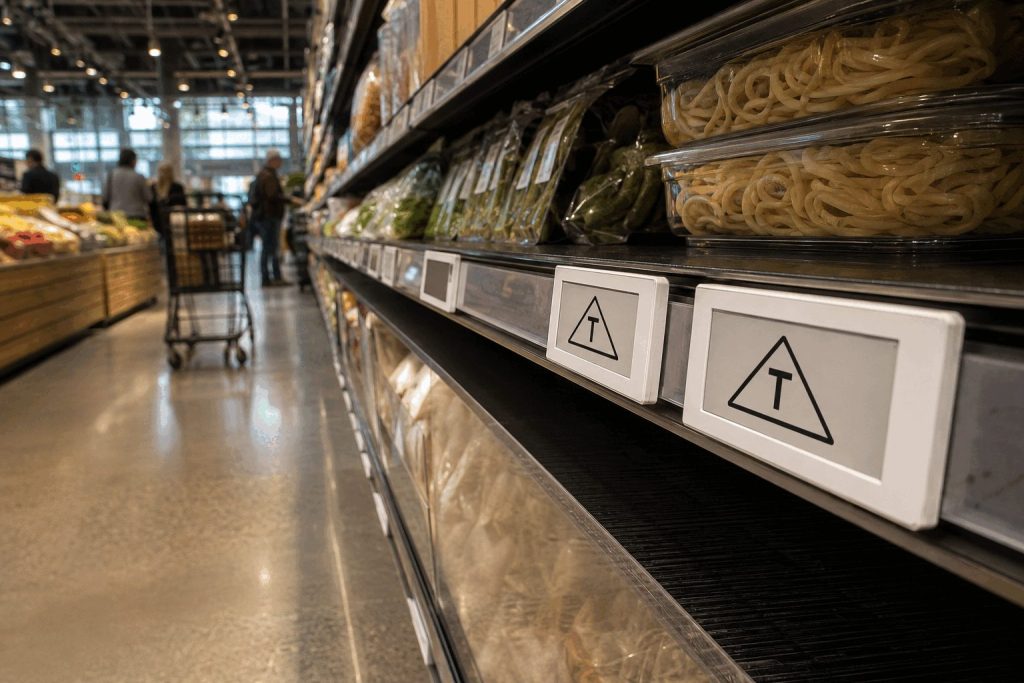
Loblaw Companies Limited is reinstating tariff labels on store shelves as trade friction between Canada and the U.S. affects a wider range of products.…
The returning “T” marker makes tariff exposure visible to shoppers. The investment question is whether sourcing changes keep merchandise costs inside Loblaw’s narrow quarterly margin range.
Loblaw will restore shelf markers for products whose prices are affected by tariffs. It will also restore country-of-origin labels in fresh produce.
Rollout begins with a small number of items and expands as tariffs reach more categories. Announced Aug. 26.
| Q2 2026 | Result | YoY |
|---|---|---|
| Retail revenue | C$15.046bn | +4.1% |
| Food retail sales | — | +3.3% |
| Food same-store sales | — | +1.6% |
| Retail gross margin | 32.2% | +10 bp |
| Retail operating income | C$1.202bn | +2.9% |
| Retail free cash flow | C$856m | +C$235m |
A 10-basis-point shift equals about 1.25% of Q2 retail operating income. Actual tariff cost, pricing, mix and supplier mitigation are undisclosed.
| TSX ticker | Price | Day |
|---|---|---|
| Loblaw · L | C$61.26 | +0.01% |
| Metro · MRU | C$89.77 | −0.21% |
| George Weston · WN | C$98.07 | −0.27% |
The muted tape shows no broad grocery-sector repricing at the observation time.
Moderate Buy
| Strong buy | 1 |
| Buy | 4 |
| Hold | 2 |
| Average target | C$71.00 |
| Target vs. C$61.26 | +15.9% |
Consensus compilation dated Aug. 6, 2026.
Category reach: number and sales weight of products carrying the T marker.
Sourcing mix: domestic and non-U.S. substitutions against affected imports.
Margin: retail gross margin versus the latest 32.2% and +10-bp change.
Demand: food same-store sales and basket size after label expansion.
Tariffs can raise procurement expense, but labels alone may not affect earnings. Domestic sourcing could offset costs; supplier shifts could also narrow assortment or add logistics expense. Without category-level exposure, the C$15.0 million sensitivity should not be read as a forecast.
Sources: Loblaw Q2 2026 release; The Canadian Press, Aug. 26; Google Finance market snapshot; MarketBeat analyst compilation. Financial figures in Canadian dollars.
Salesforce and Nvidia Lead KASE Global as Asia Closes Mixed27/08/2026 · 23:57 SGT LIVE SESSION · KASE GLOBAL Late Asia: software and chips lead…
Rasonque won U.S. approval Wednesday, giving Revolution Medicines, Inc. its first commercial product. The stock rose 0.77% to $213.01 at 11:55 a.m. EDT.
Rasonque is now a first-in-class, once-daily oral RAS inhibitor for certain adults with metastatic pancreatic cancer.
| Metric | Amount | Ratio to market cap |
|---|---|---|
| Quoted market value | $45.65B | 100% |
| Cash and securities, June 30 | $3.94B | 8.6% |
| 2026 operating-expense midpoint | $2.15B | 4.7% |
| Q2 operating expenses | $505.1M | 1.1% |
| Q2 net loss | $644.4M | 1.4% |
Pricing remains unknown. Slow coverage decisions can defer revenue even after approval.
Manufacturing limits or weak real-world uptake would pressure launch estimates.
The average analyst target offers only 4.6% upside. Failed expansion trials would narrow the revenue base.
Approval creates the first direct sales channel for Revolution Medicines. The financial test is whether Rasonque’s launch and later-label expansion can grow into a $45.65 billion valuation while annual operating expenses run near $2.15 billion.
MINNEAPOLIS, August 26, 2026, 11:48 – Target stock rose 0.6% on Wednesday following a rapid selloff that erased $2.9 billion in market value after…
The Wednesday bounce recovered only a small part of Tuesday’s product-governance repricing.
Tuesday’s market-value loss equaled about 1.86× underlying quarterly operating income.
| Company | Price move | P/E | Avg target | Implied |
|---|---|---|---|---|
| Target | +0.61% | 17.0× | $165.96 | +1.0% |
| Walmart | −1.00% | 37.8× | $129.57 | +24.2% |
| Costco | −0.46% | 48.0× | $1,101.44 | +15.3% |
Google Finance, August 26, 2026. Analyst sample sizes: Target 28, Walmart 32, Costco 21.
The direct merchandise loss is immaterial. Repeated failures would matter through traffic, conversion and markdown risk.




![Asia Stock Market Today 27/08/2026 [UPDATE: 23:57 SGT] [Salesforce and Nvidia Lead KASE Global as Asia Closes Mixed]](https://ts2.tech/wp-content/uploads/2026/08/Asia-market-dashboard-2026-08-27-2355-1024x683.jpg "Asia Stock Market Today 27/08/2026 [UPDATE: 23:57 SGT] [Salesforce and Nvidia Lead KASE Global as Asia Closes Mixed]")