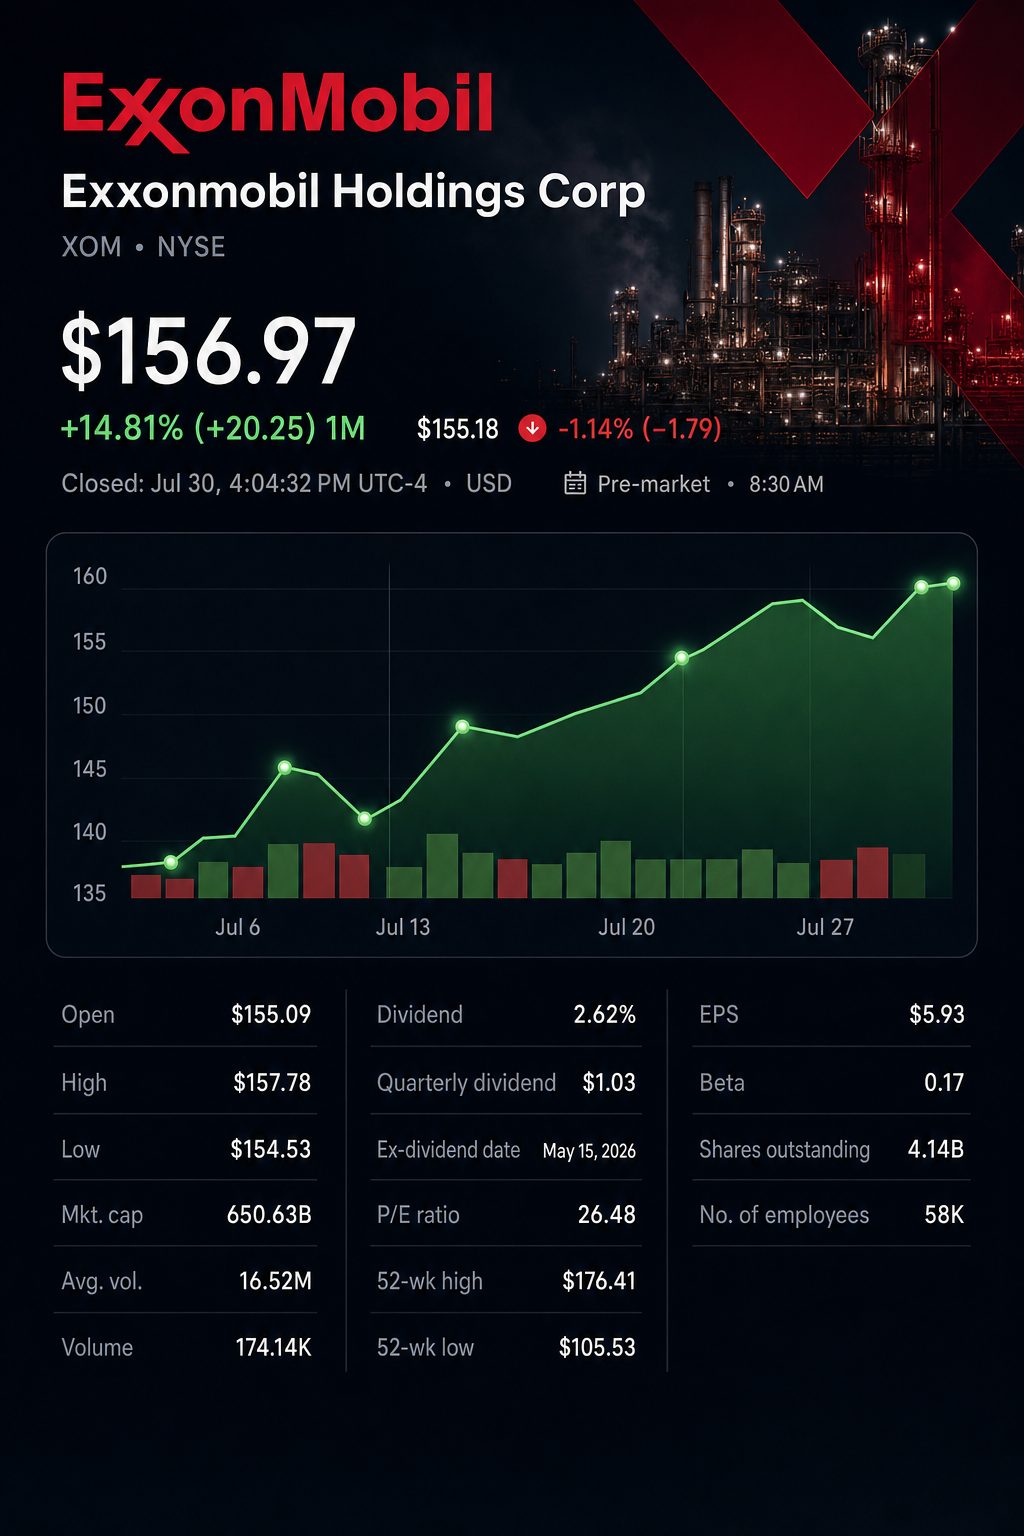
HOUSTON, July 31, 2026, 07:06 CDT — Exxon Mobil’s U.S. stock traded lower before the opening bell.
- Exxon posted adjusted earnings of $3.52 per share, missing the $3.60 per share forecast from LSEG. Exxon shares declined roughly 2% in pre-market trading.
- Shareholder distributions were $7.84 billion less than free cash flow. Net debt declined by around $7 billion.
- According to company figures, refining, chemicals, and specialty products accounted for 46% of the adjusted profit increase from the previous quarter.
Shares of Exxon Mobil Corp. were set to fall roughly 2% on Friday after adjusted earnings came in eight cents per share below LSEG’s forecast, despite the company reporting its strongest quarterly profit in four years.
Of greater note was the amount of cash available after distributions. Exxon reported $17.24 billion in free cash flow. The company spent $9.4 billion on dividends and share buybacks, resulting in $7.84 billion remaining.
The amount was close to the stated $7 billion reduction in net debt. The decrease represented 89% of the estimated remainder. CFO Neil Hansen stated that strengthening the balance sheet would come before any increase in distributions to shareholders.
The yearly share repurchase goal stayed at $20 billion. Exxon kept its quarterly dividend unchanged at $1.03 per share. As a result, higher oil prices bolstered the company’s financial strength rather than boosting immediate shareholder payouts.
Exxon quarterly results
| Metric | Q2 2026 | Q1 2026 | Q2 2025 | Change or benchmark |
|---|---|---|---|---|
| Adjusted EPS | $3.52 | $2.09 | $1.64 | 2.2% under LSEG estimate |
| Adjusted earnings | $14.68 bln | $8.77 bln | $7.08 bln | up 67% q/q; up 107% y/y |
| Operating cash flow | $23.56 bln | $8.71 bln | $11.55 bln | 171% increase q/q |
| Free cash flow | $17.24 bln | $2.70 bln | $5.39 bln | rising 539% q/q; up 220% y/y |
| Production | 4.514 mln boepd | 4.594 mln | 4.630 mln | down 1.7% q/q; down 2.5% y/y |
Data from company disclosures and LSEG consensus sourced via Reuters. Percentage shifts are derived from reported numbers.
The quarter delivered strong but inconsistent results. Adjusted earnings rose by 67% over the previous quarter. Output declined while Brent crude averaged $96.68, an increase of 23%.
Integration was a key driver of the recovery, as refining, chemicals and specialty products contributed $2.72 billion in adjusted profit. This accounted for 46% of the $5.91 billion quarter-on-quarter gain for Exxon.
Breakdown of Exxon’s $5.91 billion adjusted profit rise
| Segment | Q2 adjusted earnings | Q1 adjusted earnings | Sequential gain | Share of total gain |
|---|---|---|---|---|
| Upstream | $9.189 bln | $6.265 bln | $2.924 bln | 49.5% |
| Energy Products | $4.099 bln | $2.799 bln | $1.300 bln | 22.0% |
| Chemical Products | $1.214 bln | $0.110 bln | $1.104 bln | 18.7% |
| Specialty Products | $0.969 bln | $0.651 bln | $0.318 bln | 5.4% |
| Corporate and Financing | -$0.791 bln | -$1.053 bln | $0.262 bln | 4.4% |
| Total | $14.680 bln | $8.772 bln | $5.908 bln | 100% |
Figures are based on Exxon’s adjusted segment performance.
Exxon’s refining and fuels division, Energy Products, contributed $1.30 billion. The Chemicals segment brought in an additional $1.10 billion. Upstream was still the top performer, generating $2.92 billion.
CEO Darren Woods stated, “The second quarter was shaped by disruption, but defined by execution.” Exxon achieved its strongest second-quarter diesel output using its existing asset base. Exxon Mobil Corporation
Cash coverage shifted significantly compared to the first quarter. The comparison is not exact, as margin postings on derivatives weighed on Exxon’s reported cash flow in the first quarter.
Shareholder returns and free cash flow
| Cash metric | Q2 2026 | Q1 2026 |
|---|---|---|
| Free cash flow | $17.24 bln | $2.70 bln |
| Dividends | $4.30 bln | $4.30 bln |
| Share repurchases | $5.10 bln | $4.90 bln |
| Total distributions | $9.40 bln | $9.20 bln |
| FCF coverage of distributions | 1.83 times | 0.29 times |
| FCF after distributions | +$7.84 bln | -$6.50 bln |
Coverage and residual amounts are calculated figures and do not represent official accounting reconciliations.
The Q2 residual continues to align with the reported decrease in debt. Investors got the expected payout, with no signs of acceleration. Exxon opted to maintain flexibility heading into another potentially volatile quarter.
Chevron Corp. NYSE:CVX provided the most distinct comparison among peers, surpassing LSEG’s EPS projection by 9% and advancing roughly 2% in premarket trading. Exxon posted a 2.2% miss and declined.
Exxon against Chevron
| Q2 2026 measure | Exxon Mobil | Chevron |
|---|---|---|
| Adjusted earnings | $14.68 bln | $12.00 bln |
| Adjusted EPS | $3.52 | $6.06 |
| LSEG estimate | $3.60 | $5.56 |
| Earnings surprise | -2.2% | +9.0% |
| Production | 4.514 mln boepd | 4.000 mln boepd |
| Production change from Q1 | -1.7% | +3.9% |
| Shareholder distributions | $9.4 bln | $6.5 bln |
| Early premarket move | Approximately -2% | Roughly +2% |
Consensus, market activity and Chevron statistics are sourced from Reuters. Exxon numbers reflect company filings.
Chevron increased output to 4 million boepd. According to Reuters, the company’s lesser exposure in the Middle East helped minimize disruption. RBC analyst Biraj Borkhataria described Chevron’s results as “robust operational performance and strategic consistency.” Reuters
Exxon experienced an opposing production impact. Hansen attributed the missed estimate in part to “extreme swings” in both prices and margins. Approximately 450,000 boepd is still offline in Qatar. Reuters
An entire quarter-long shutdown of the Strait of Hormuz may reduce Middle East production by 750,000 boepd compared to the previous year. This amount is about 16.6% of Exxon’s group output in the second quarter. Additionally, 50,000 bpd remained shut in the United Arab Emirates.
Permian output exceeding 1.8 million boepd offers a degree of resilience. The fifth production vessel in Guyana is still planned to come online in the fourth quarter. This unit is set to increase capacity by 250,000 bpd.
Before Friday, Exxon shares had risen 28% this year. The S&P 500 energy index increased by 29%. As a result, there was minimal tolerance for even a slight miss in estimates.
Risks are still focused on the Middle East. Ongoing restrictions on shipping may cut output and postpone sales. A lasting ceasefire could push oil prices and refining profits lower. U.S. monitoring of fuel prices introduces further policy uncertainty.
The upcoming assessment focuses on third-quarter cash conversion, with investors monitoring if debt continues to consume the majority of leftover cash. The scheduled Guyana startup in the fourth quarter remains the next obvious driver for volumes.
Related articles: NYSE:CVX