Bitcoin recorded its steepest weekly surge in over two years, sending Strategy Inc shares above the average price of its substantial cryptocurrency holdings. The stock climbed even more rapidly. As a result, Monday’s buyers face greater exposure to potential gains, but the company has limited protection on its balance sheet should bitcoin prices fall.
MSTR outran bitcoin last week. That added upside beta, but the treasury’s mark-to-market gain remains small relative to the stock move.
Market data: Friday, August 21, 2026, 4:00 PM EDT. Holdings: August 16, 2026. U.S. equities closed; crypto trades continuously. Prepared Sunday, August 23, 2026, 8:02 PM EDT.
| Week through Aug. 16 | Amount | Read-through |
|---|---|---|
| MSTR shares sold | 3.46M | Common dilution funded liquidity |
| Net proceeds | $333.7M | No bitcoin bought or sold |
| USD reserve addition | $149.1M | Reserve reached $4.8B |
| STRC repurchases | $132.2M | Reduced preferred overhang |
| Preferred dividends | $52.4M | Recurring claim ahead of common |
Sources: WSJ and FT market reports; StockAnalysis closing data; Strategy’s August 17 filing as summarized by The Block; Investing.com analyst consensus. Values are rounded. Treasury gain is a preliminary gross mark before debt, preferred claims, taxes, fees or dilution.
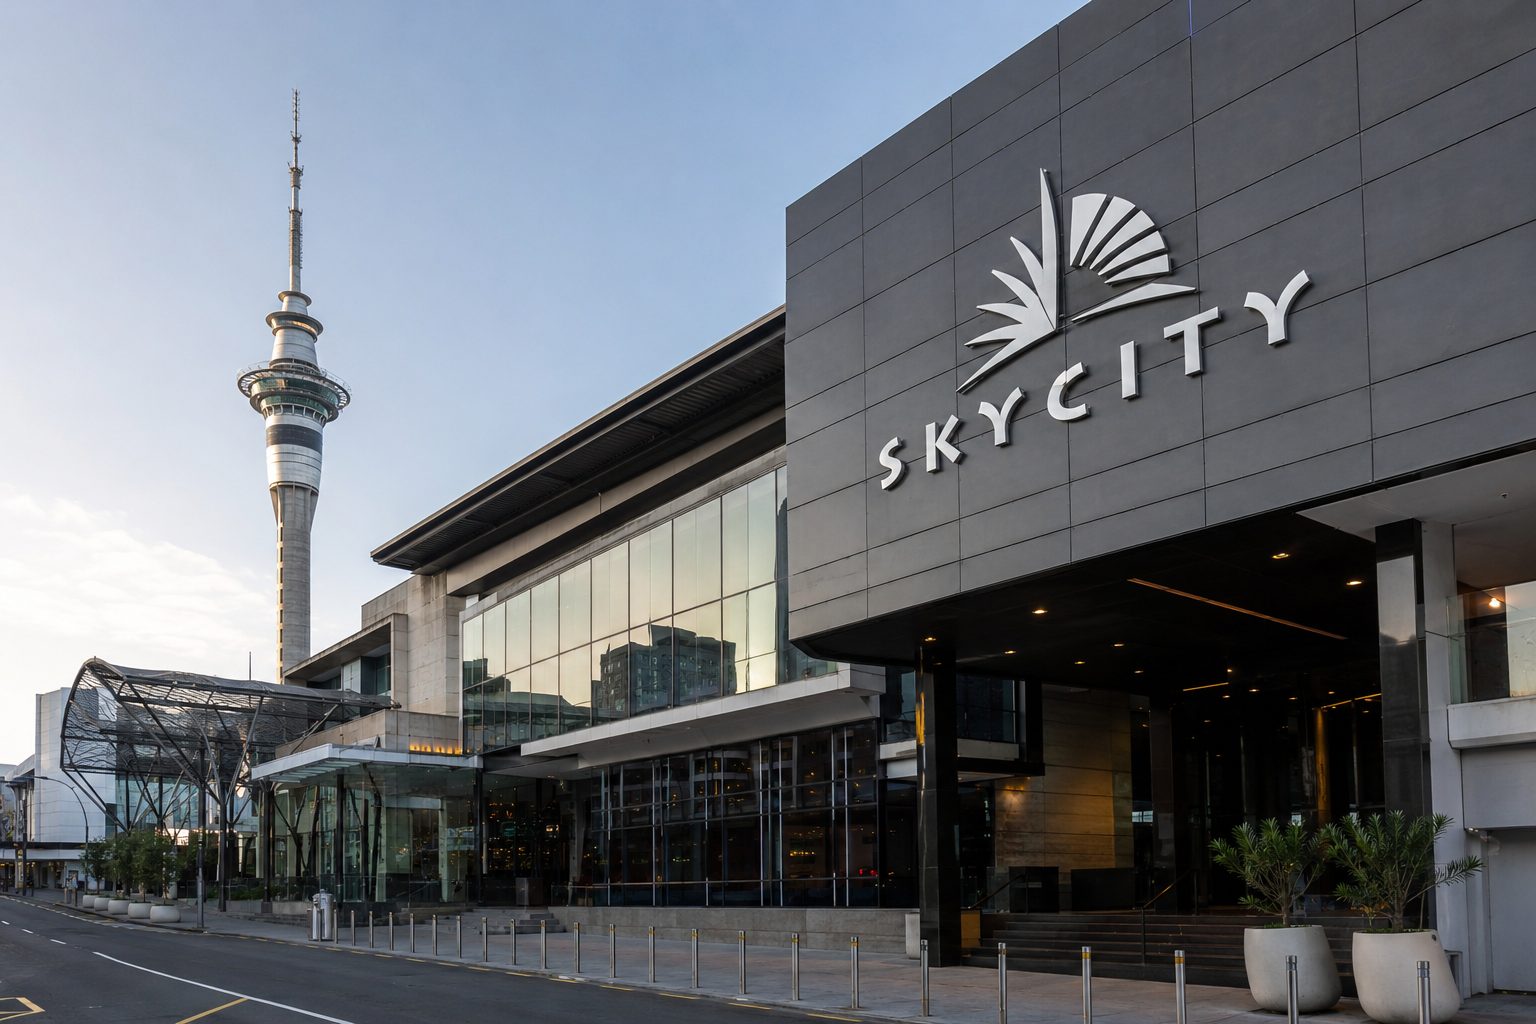
The stock rallied after FY26 results shifted attention from falling profit to asset sales, cash conversion and cost benefits.
Market open
Price: August 24, 2026, 10:26 a.m. NZST
NZX data delayed 20 minutes
The rally capitalises 71% of the FY28 benefit target. Delivery still matters.
| Underlying | FY26 | FY25 | Change |
|---|---|---|---|
| Revenue | NZ$822.7m | NZ$825.2m | -0.3% |
| EBITDA | NZ$181.6m | NZ$233.7m | -22.3% |
| EBITDA margin | 22.1% | 28.3% | -6.2pp |
| Net profit | NZ$38.0m | NZ$71.5m | -46.9% |
| Operating cash inflow | NZ$121.7m | NZ$45.2m | +169.4% |
The asset programme equals 38%–42% of current market value. The Grand hotel agreement remains non-binding.
| Mean recommendation | BUY |
| Analysts | 4 |
| Average target | NZ$1.012 · +55.7% |
| Low target | NZ$0.800 · +23.1% |
| High target | NZ$1.500 · +130.8% |
Targets may lag the newest earnings information.
| September 2026 | NZ$74.5m office-sale settlement |
| Late 2026 | Online-casino licence decisions expected |
| FY27 | NZ$30m annualised operating benefits |
| FY27 | Leverage below 2.0× |
| FY28 | NZ$70m total benefits target |
Soft discretionary spending, Adelaide remediation costs and the May 2027 bond maturity still matter. Asset-sale delays or weak savings would reopen the funding question. The regulated online opportunity is not secured; SkyCity must win a licence before it can participate.
| Analyst rating split | 1 Buy / 3 Hold / 1 Sell |
| Average target | NZ$9.46 |
| Target range | NZ$8.43–NZ$10.26 |
| Net debt | NZ$3.174bn |
| Net debt / EBITDA | 4.37× |
| EBITDA guidance | NZ$730m–NZ$760m |
| Gross capex guidance | NZ$375m–NZ$415m |
| Copper retirement target | 2028 |
| Fibre connections | 1.147m |
| Fibre uptake | 75.9% |
The dividend floor is supported by stronger cash generation and falling legacy-network costs. The offset is leverage and a share price already above the average target.
Bias: income-led, with rerating dependent on delivery above the FY27 EBITDA midpoint.
Copper scarcity: metal prices stayed near historic highs as supply remained tight.
Structural demand: AI data centers, grids and electrification strengthened the long-run demand case.
Equity leverage: each 10-cent copper move changes Freeport's 2026 cash-flow model by about $150 million.
Stretch: the stock rose 15.3% for the week while COMEX copper fell 0.5%.
| Measure | Reading | YoY |
|---|---|---|
| Revenue | $7.03B | -7% |
| Copper sales | 710M lb | -30% |
| Realized copper | $6.17/lb | +36% |
| Net cash cost | $1.97/lb | +74% |
| Operating cash flow | $2.05B | — |
| Target | Price | Vs. $76.66 |
|---|---|---|
| Average | $71.73 | -6.4% |
| Median | $75.00 | -2.2% |
| High | $82.00 | +7.0% |
| Low | $30.00 | -60.9% |
| Consensus | Buy | 23 analysts |
Strategic win Google can earn warrants as purchases scale. The agreement broadens Marvell’s custom-AI role.
Not backlog The $120B figure is a cumulative ceiling tied to 240 revenue milestones.
Expectation risk Friday’s 5.6% drop showed investors are already demanding proof.
| Measure | Value | Read-through |
|---|---|---|
| Maximum shares | 58.97M | ≈6.7% potential dilution |
| Exercise price | $206.58 | 12.9% below Friday |
| Time-based shares | 1.36M | Small fixed portion |
| Revenue tranches | 240 × $500M | $120B ceiling |
| Horizon | FY2033 | Long execution runway |
RBC expects a slight beat and a 2%–4% lift to next-quarter guidance, led by optical demand.
| Firm | View | Target | Upside |
|---|---|---|---|
| BMO | Outperform | $250 | 5.5% |
| Citigroup | Buy | $275 | 16.0% |
| Oppenheimer | Outperform | $300 | 26.6% |
| UBS | Buy | $310 | 30.8% |
| RBC | Outperform | $360 | 51.9% |
The Google deal reduces strategic doubt. It does not remove execution risk. The best near-term signal is whether Marvell converts AI bookings into revenue while keeping gross margin near 59%.
Risk: delayed purchases, tight wafer supply, weaker guidance or warrant dilution can unwind the premium quickly.
AI funding versus dilution · weekend investor dashboard
Market data: Aug. 21, 2026, 16:00 EDT
Profit reset: net income fell 75% as investment accelerated.
Fresh supply: the new shares equal about 3.8% of the quarter's weighted basic count.
Growth offset: AI Cloud revenue rose 45% and adjusted EBITA rose 133%.
Sources: Alibaba Group June-quarter results and placement pricing; Reuters; Stock Analysis. Prices are historical and reflect the Aug. 21, 2026 NYSE close at 16:00 EDT. Placement USD values use the reported HKD/USD conversion. Markets were closed when this dashboard was prepared.
| Eligible shares | 319.0M |
| Aug. 20 volume | 119.0M |
| Aug. 21 volume | 78.1M |
| Two-day move | -1.92% |
| Segment | Revenue | YoY | Share |
|---|---|---|---|
| Connectivity | $4.29B | +66% | 54.9% |
| AI | $2.56B | +247% | 32.8% |
| Space | $0.96B | +29% | 12.3% |
| Segment | Operating result | Capex |
|---|---|---|
| Connectivity | +$1.66B | $1.37B |
| Space | -$0.54B | $1.17B |
| AI | -$1.26B | $15.83B |
| Group | -$0.14B | $18.37B |
| Morgan Stanley / Buy | $300 |
| Clear Street / Buy | $217 |
| DZ Bank / Sell | n/a |
Sources: SpaceX SEC Form 10-Q and Q2 earnings release; SEC IPO filing; MarketWatch; S&P Global Market Intelligence and TipRanks via StockAnalysis. Calculations are preliminary and may differ due to rounding.
| Metric | Q3 FY26 | YoY |
|---|---|---|
| Revenue | $109.4B | +16.4% |
| Services | $30.739B | +12.1% |
| Net income | $29.789B | +27.1% |
| Diluted EPS | $2.02 | +28.7% |
| Company | Forward P/E | 52-week move | Read-through |
|---|---|---|---|
| Apple | 33.78× | +36.87% | Highest multiple in group |
| Amazon | 27.91× | +15.56% | Commerce + cloud |
| Alphabet | 25.87× | +73.00% | Ad and AI scale |
| Microsoft | 24.49× | −4.45% | Enterprise AI |
| Meta | 17.17× | −26.46% | Lowest multiple |
| Delivery window | Contract | Expected |
|---|---|---|
| H2 2026 | 3 | 0 |
| 2027 | 44 | 20 |
| After 2027 | 120 | 147 |
Consensus: Strong Buy. Twenty-seven of 28 recommendations are Buy or Strong Buy.
The market punished loss of marketing control, then bought the schedule. Thursday's August 27 extended preview is the next measurable checkpoint. Engagement and a firm November 19 release date matter more than the leaked clips themselves.
| Metric | Q2 FY26 | Q2 FY27 est. | Growth |
|---|---|---|---|
| Revenue | $46.7B | $92.16B | +97% |
| Adjusted EPS | $1.05 | $2.09 | +99% |
| Data Center | $41.1B | $85.67B | +108% |
| Data Center mix | 88% | 93% | +5 pts |
| Firm | View | Target | Upside |
|---|---|---|---|
| BMO | Outperform | $340 | 58% |
| RBC | Outperform | $300 | 40% |
| Morgan Stanley | Overweight | $288 | 34% |
| Oppenheimer | Outperform | $265 | 23% |
| Stifel | Buy | $282 | 31% |
Rates rose as expectations stayed high.
The semiconductor index lost about 5% last week. Nvidia fell every session as long-bond yields climbed. Friday’s reported server-price increase now adds an input-cost question before earnings.
The stock recovered faster than analysts raised targets. Consensus now implies only 3.92% upside, while the $174–$350 range signals deep disagreement.
Forecasts from 25 analysts. The spread is $176.
Consensus label: Buy. The mix is less bullish than the headline suggests.
Sources: IBM Q2 2026 results and August 19 quantum update; StockAnalysis price history and analyst forecasts; MarketWatch peer comparison. Forecasts are not guarantees.
| Stock | Market cap | TTM sales | P/S |
|---|---|---|---|
| QUBT | $2.02B | $9.82M | 206× |
| IONQ | $17.89B | $246.47M | 73× |
| RGTI | $5.98B | $13.35M | 448× |
| QBTS | $7.49B | $12.43M | 603× |
Sector rotation, not fresh company news.
QUBT rallied with IONQ, RGTI and QBTS after three declining sessions. The volume jump supports a risk-on move. The latest company earnings release remains the Aug. 10 Q2 report.
A close above $9.18 would strengthen the rebound. A break below $8.14 would return focus to execution, spending and order conversion.
*Preliminary total-return estimate adds back the A$2.70 final dividend that went ex on Wednesday.
| Rating | Count | Share |
|---|---|---|
| Strong sell | 11 | 79% |
| Sell | 3 | 21% |
| Hold / Buy | 0 | 0% |
| Average target | A$125.21 | −20.75% |
| Highest target | A$144.99 | −8.23% |
The bearish consensus is unusual in its unanimity. Even the highest tracked target remains below Friday's close.
Investor read: Holding A$156.44 would keep Friday's bounce alive. A failure there would put the residual de-rating—not the dividend adjustment—back at the centre of the trade.
Recent calls: JPMorgan Buy, A$67; RBC Hold, A$60; Macquarie Hold, A$55.
Target range: A$42.76–A$91.09. The spread shows how strongly commodity assumptions drive valuation.
A copper reversal would hit the new earnings narrative first. Higher FY2027 capital spending, the Jansen potash cost overrun and Western Australian iron-ore industrial action could also challenge the rerating. The stock is already above the average analyst target.
| Target | Value | Vs. $344.82 |
|---|---|---|
| Consensus average | $428.04 | +24.13% |
| Low | $340 | −1.40% |
| High | $515 | +49.35% |
| Metric | 2026 | Comparison |
|---|---|---|
| Cash & securities | $237.9m | −$80.2m in H1 |
| Q2 operating expense | $42.9m | +55.0% YoY |
| Q2 net loss | $40.7m | +57.2% YoY |
| Runway at H1 loss pace | ~19 months | Preliminary |
| Firm | Action | Rating | Target | Versus $6.29 |
|---|---|---|---|---|
| Cantor Fitzgerald | Upgrade | Buy | $28 | +345% |
| Piper Sandler | Maintain | Hold | $2 | −68% |
| B. Riley | Maintain | Hold | $5 | −21% |
| Consensus | — | Hold | $10.50 avg. | +67% |
| Median | — | — | $6 | −5% |
| Reference | Amount | ATM multiple |
|---|---|---|
| Cash + restricted cash | $508.8M | 1.18× |
| Q3 revenue midpoint | $272.5M | 2.20× |
| H1 capex | $335.1M | 1.79× |
| H1 investing cash use | $633.7M | 0.95× |
| Q2 actual | $191.9M |
| Q3 low | $255.0M |
| Q3 midpoint | $272.5M |
| Q3 high | $290.0M |
| Sale price | New shares | Dilution |
|---|---|---|
| $129.10 | 4.65M | 5.47% |
| $124.82 | 4.81M | 5.66% |
| $112.56 | 5.33M | 6.28% |
| Low target | $109 |
| Average | $163.40 |
| Median | $178 |
| High | $220 |
SELLAS' rally now rests on an event-driven Phase 3 survival readout. Cash is meaningful, but it explains only 4.4% of market value.
SLS gained 54.4% across three consecutive winning weeks.
What Friday's equity value represents
No product revenue was reported for the first half of 2026.
REGAL is event-driven; the date cannot be fixed.
Statistically significant, clinically meaningful survival could support a potential BLA filing.
A missed survival endpoint would remove the main late-stage pillar beneath valuation.
Six months ended June 30, 2026
Weekly stock moves use August 14–21 closes. Targets are current S&P Global consensus data.
| Company | Weekly move | Consensus | Analysts | Average target | Implied return |
|---|---|---|---|---|---|
| Moderna · NASDAQ:MRNA | +129.2% | Hold | 23 | $91.39 | -37.0% |
| SELLAS · NASDAQ:SLS | +21.0% | Buy | 2 | $32.50 | +110.2% |
| Merck · NYSE:MRK | +12.3% | Buy | 28 | $147.77 | -3.1% |
| ImmunityBio · NASDAQ:IBRX | +2.9% | Strong Buy | 4 | $12.75 | +63.7% |
REGAL could miss its survival endpoint or face regulatory demands for more evidence. SLS009 remains early. Warrant exercises and future equity sales can dilute holders. A reversal in cancer-vaccine sentiment could erase gains before company-specific data arrive.
Stock data: August 21, 2026, 4:00 p.m. EDT. Dashboard status: August 22, 2026, 6:24 a.m. EDT. Sources: SELLAS SEC filings; ClinicalTrials.gov; Yahoo Finance; StockAnalysis. Peer programs differ in platform, indication and stage.
Today’s highest-ranked model selections.
The catalysts most likely to move markets.
This is the clearest scheduled U.S.-market price-discovery point today and can transmit weekend news into equity-index futures before Monday's cash session.
The Q2 retail package can move NZD and regional risk sentiment. Spillover to U.S. assets is usually secondary unless the result is unusually large.
The absence of U.S. releases, earnings, IPO pricings and split events leaves fewer scheduled catalysts, increasing the relative importance of weekend headlines and positioning at the futures reopen.