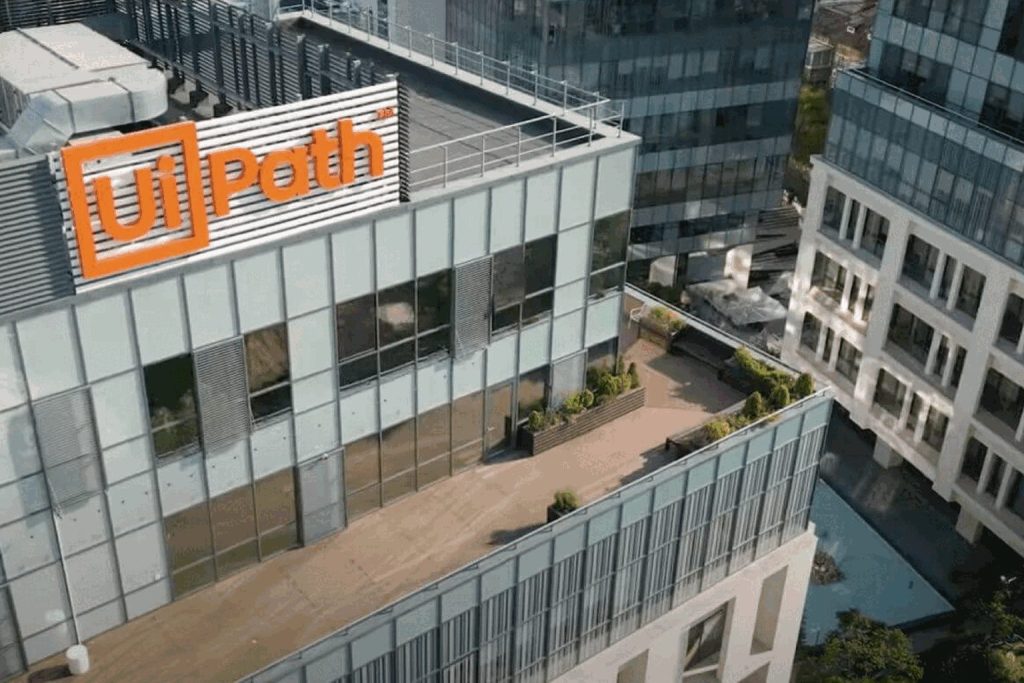
UiPath Shares Edge Down 1.0% as Options Market Expects 11% Post-Earnings Move
UiPath Inc. fell 1.0% on Friday as investors anticipated a significant swing following its earnings release. Options pricing suggests an 11% change is expected…
Market intelligence
Fast, evidence-led coverage of the companies and events moving global markets.
All coverage
UiPath Inc. fell 1.0% on Friday as investors anticipated a significant swing following its earnings release. Options pricing suggests an 11% change is expected…

| Metric | Reading |
|---|---|
| Q1 revenue | $418M |
| Q1 ARR | $1.901B |
| Net new ARR | $49M |
| Net retention | 109% |
| GAAP operating income | $28M |
| Adjusted FCF | $130M |
| Q2 revenue guide | $395M-$400M |
| Q2 EPS consensus | $0.13 |
| FY27 revenue guide | $1.776B-$1.781B |
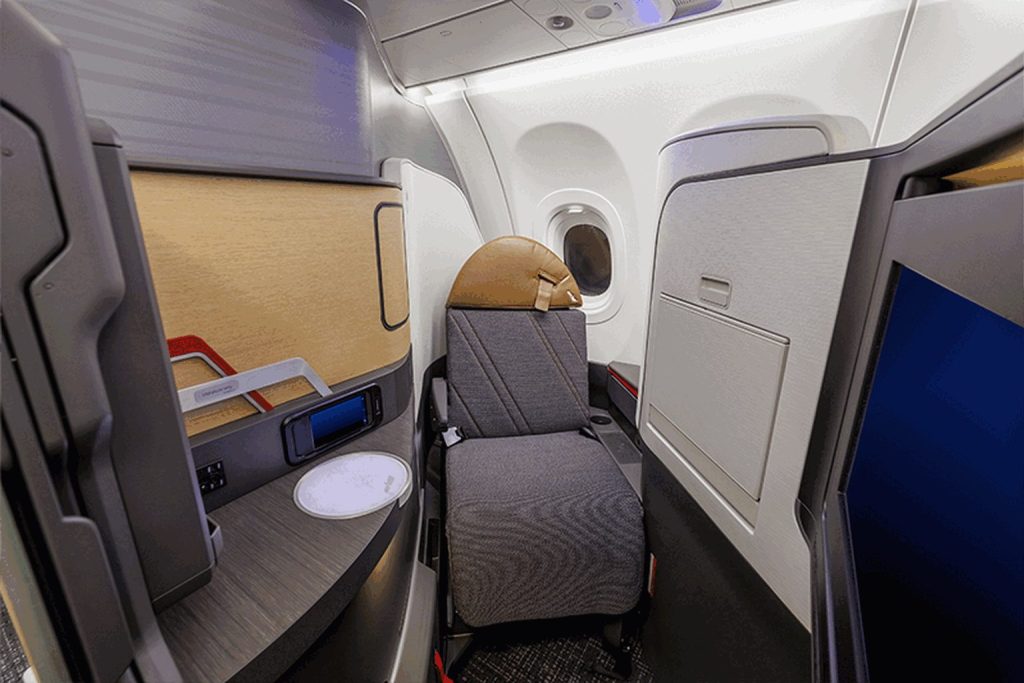
American Airlines Group Inc. closed down 0.6% on Friday after the company announced seven new daily international routes scheduled for 2027. The move increases…
| Metric | Reading |
|---|---|
| Q2 adjusted EPS | $0.15 |
| Consensus before report | $0.03 |
| Q3 revenue guide | +16% to +19% |
| Q3 adjusted EPS guide | −$0.70 to −$0.10 |
| FY26 adjusted EPS guide | −$0.65 to +$0.65 |
| Trailing EPS | −$0.49 |
PayPal Holdings lost 12.71% on Friday after Advent International and Stripe abandoned their takeover pursuit. The shares closed at $53.66 on 36.34 million shares.
Deal premium vanished. The standalone margin bridge is back.
The displayed analyst average and abandoned bid sit almost together. Both are roughly 12% above Friday's close.
| Measure | PayPal | Reference |
|---|---|---|
| Forward P/E | 10.85× | Industry median ~15× |
| Price / 2026 EPS guide | 9.97× | $5.38 adjusted EPS |
| Offer premium to close | 12.7% | $60.50 vs. $53.66 |
| Analyst average upside | 12.2% | $60.20 vs. $53.66 |
| Metric | Result | Signal |
|---|---|---|
| Revenue | $8.68B | 3% constant-currency growth; $8.47B estimate |
| Total payment volume | $486.4B | 9% constant-currency growth |
| Adjusted EPS | $1.38 | Beat $1.28 estimate |
| Adjusted operating margin | 17.4% | Down 248 basis points |
Friday's move did more than remove a takeover premium. It priced PayPal almost exactly at ten times its 2026 adjusted EPS guide. The discount can close if checkout share and margins stabilize. If both keep falling, the industry discount is justified.
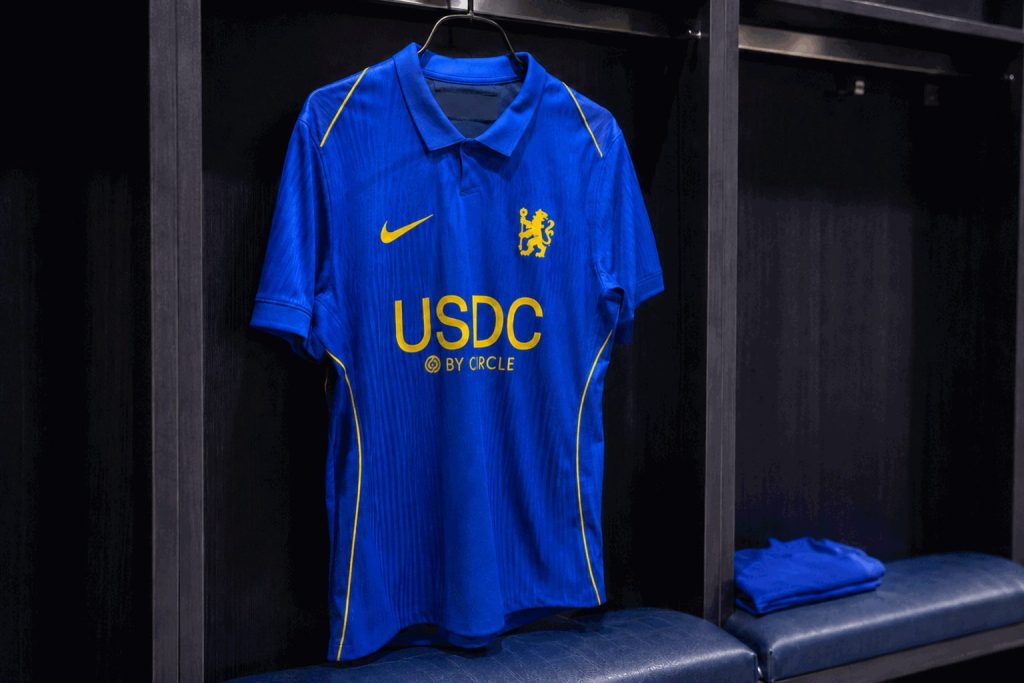
USDC has landed a prime spot in football advertising, with its branding set to appear on Chelsea's shirts for the entirety of the 2026/27…
Visibility is immediate. The circulation return must still be earned.
| Added average USDC | Annual gross reserve income | After 61.7% cost ratio |
|---|---|---|
| $1B | $34.8M | $13.3M |
| $3B | $104.4M | $40.0M |
| $5B | $174.0M | $66.6M |
Scenario holds the Q2 reserve return rate at 3.48% and the cost ratio constant. It is not guidance.
Chelsea supplies global brand reach, but Circle earns mainly from the assets backing USDC. A durable return requires higher average circulation or greater fee revenue. Watch the weekly balance trend, reserve yield and distribution-cost ratio.
Risks: undisclosed sponsorship cost, weaker interest rates, stablecoin competition, marketing regulation and limited conversion from awareness to funded balances.
Sources: Circle transparency and Q2 2026 results; Chelsea FC partnership announcement; Reuters; market data as of Aug. 28, 2026. Scenario values are estimates.
Marvell Technology Inc. shares slid 10.28% on Friday, wiping out close to $22.4 billion in implied equity value.
Record AI demand meets a delayed revenue bridge
| Measure | Reading | Signal |
|---|---|---|
| FY2027 EPS estimate | $4.20 | 51.6× P/E |
| FY2028 EPS estimate | $6.69 | 32.4× P/E |
| Average target | $291.26 | 34.5% upside |
| Median target | $295.00 | 36.2% upside |
| Rating mix | 37 Buy/Overweight | 6 Hold, 0 Sell |
Marvell’s current AI business is accelerating, but the market is discounting a longer bridge to Google revenue. The stock can recover if near-term custom compute and interconnect growth preserve the $18 billion fiscal 2028 target without sacrificing gross margin.
Key risks: customer concentration, Google schedule slippage, a 51.6× fiscal 2027 earnings multiple, and integration of Celestial AI and XConn.
Sources: Marvell Q2 FY2027 release; Reuters, Aug. 28, 2026; WSJ/FactSet market data and research ratings; SEC filings. Estimates are not company guarantees.
WEST PALM BEACH, Florida, August 30, 2026, 09:08 – Shares of Ondas declined by 9.7% after the company reported an EBITDA loss of $50.6…
Backlog growth is strong. Loss conversion is the test.
Market data: August 28, 2026, 16:00 EDT · After-hours: 19:59 EDT · Dashboard updated August 30, 2026, 09:12 EDT
Friday's fall exceeded the S&P 500's 0.25% decline and the industrial-goods group's 1.26% drop.
$757M equals 1.41× the $537.5M midpoint of 2026 revenue guidance.
| Metric | Q2 2026 | Q1 2026 |
|---|---|---|
| Revenue | $83.8M | $50.1M |
| Gross margin | 43.1% | 49.2% |
| Adjusted EBITDA | −$50.6M | −$10.9M |
| Cash operating expense | $93.3M | $36.9M |
| Net income / loss | −$89.7M | $361.2M |
| Market cap / FY26 revenue midpoint | 8.4× |
| FactSet rating mix | 10 Buy · 0 Hold · 0 Sell |
| Average target | $19.42 · 146% above close |
| Target range | $13–$25 |
| Next expected report | November 16, 2026 |
Ratings and targets shown by WSJ/FactSet on August 28, 2026.
Cash, restricted cash and short-term investments totaled $1.4B at June 30. Ondas then used about $325M to close DZYNE and Cyberhawk. The remaining cash balance cannot be derived precisely without later operating and investing flows.
The stock assigns substantial value to the $757M backlog and defense-drone platform. Friday's decline says investors want proof that volume deliveries can lift gross profit faster than cash operating expense.
Backlog timing, contract milestones, integration costs and margin mix can shift quarterly results. Acquisitions may consume more cash. Equity issuance could dilute the per-share backlog claim.
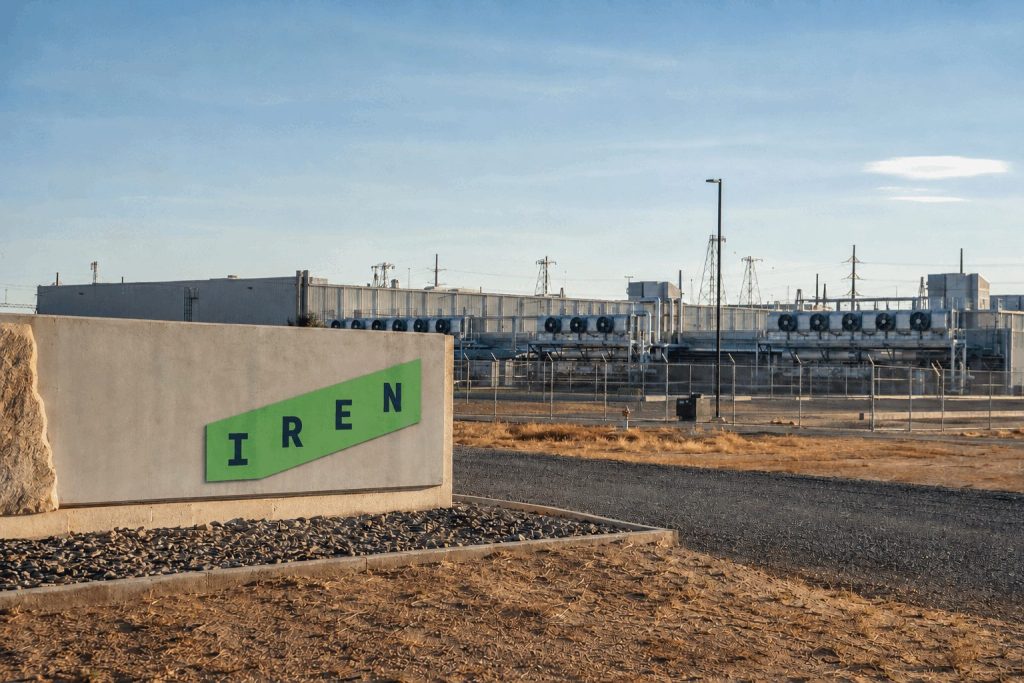
NEW YORK, August 30, 2026, 08:16 — Shares of IREN declined by 12.5% after the company unveiled $4 billion in new AI contracts at…
Market data: August 28, 2026, 16:00 EDT · Dashboard updated August 30, 2026, 08:18 EDT
AI Cloud overtook mining for the first time. Mining revenue fell 40% sequentially as hardware was retired.
The quarter proved demand but weakened near-term earnings. Adjusted EBITDA dropped 68% sequentially to $19.2m. Net loss reached $684.0m, including a $450.4m non-cash impairment.
AI mix improvedEBITDA compressedMining exit accelerated| US$ millions | FY2025 | FY2026 | Change |
|---|---|---|---|
| Total revenue | 501.0 | 707.0 | +41% |
| AI Cloud revenue | 16.4 | 128.8 | ≈8× |
| Adjusted EBITDA | 269.7 | 245.7 | −9% |
| Net income / loss | 86.9 | −702.6 | −789.5 |
| Non-cash impairments | — | 638.8 | Transition cost |
Market value / contracted ARR: about 3.2×. Market value / FY2026 revenue: about 17.9×. ARR is non-GAAP and may convert into recognized revenue more slowly.
| Microsoft GPU financing | $3.6bn | 6.0% |
| New GPU facilities | $2.8bn | 9.0% |
| Cash + commitments + prepayments | $14bn | |
| Customer prepayments | 45%–55% of related GPU capex | |
| Operational power | 810 MW | |
| Under construction | 2.1 GW | |
| Secured pipeline | >5 GW | |
Horizon 2: commissioning underway.
Horizon 3–4: delivery targeted in Q4 2026.
Microsoft: first 50 MW liquid-cooled deployment delivered in August.
2027: company targets cumulative delivery of about 0.8 GW IT load.
| Company | Close | Friday move | Volume | Market value |
|---|---|---|---|---|
| IREN | $35.45 | −12.53% | 88.62m | $12.67bn |
| CoreWeave | $84.23 | −2.94% | 17.33m | $46.41bn |
| MARA Holdings | $10.67 | −10.15% | 41.93m | $4.07bn |
IREN underperformed both peers, pointing to company-specific concern about transition timing and earnings quality.
B. Riley: Nick Giles viewed the quarter as validating IREN's commercial and financing path.
H.C. Wainwright: Buy rating retained; $90 target. That target is roughly 154% above Friday's close.
Named recommendations reported August 28, 2026. They are not a full consensus.
ARR conversion may lag. Large contracts create customer and counterparty concentration. Construction slippage, 6%–9% debt costs and more mining write-downs could delay free cash flow.
Upside sensitivities: faster commissioning, higher GPU utilization and managed-services revenue.
NVIDIA Corporation fell 4.57% to $217.55 on Friday. The decline erased about $251 billion of equity value, based on 24.1 billion shares outstanding.
| Measure | Q2 FY2027 | Comparison | Investor reading |
|---|---|---|---|
| Revenue | $96.2B | +106% YoY | Demand remains exceptional |
| Data Center | $89.0B | 92.5% of revenue | Concentration amplifies infrastructure-cycle risk |
| GAAP operating income | $63.7B | +124% YoY | Scale still outpaces expense growth |
| Accounts receivable | $63.1B | $38.5B in January | Working-capital exposure is rising |
| Inventory | $31.6B | $21.4B in January | Supply preparation raises execution stakes |
| Capital returned | $26.0B | $99.0B authorization left | Supportive, but small versus market value |
The Friday selloff erased more than two and a half quarters of current revenue in market value. Yet the stock remained above its pre-earnings level. Investors accepted the demand case but demanded cleaner proof that supply, China exposure and gross margin can support it.
Memory shortages could cap shipments despite firm orders.
Q3 guidance assumes no Data Center compute revenue from China.
A 12.1× annualized sales multiple leaves little room for delayed spending.
Next confirmed event: Goldman Sachs Communacopia + Technology Conference · Sep. 10, 2026.
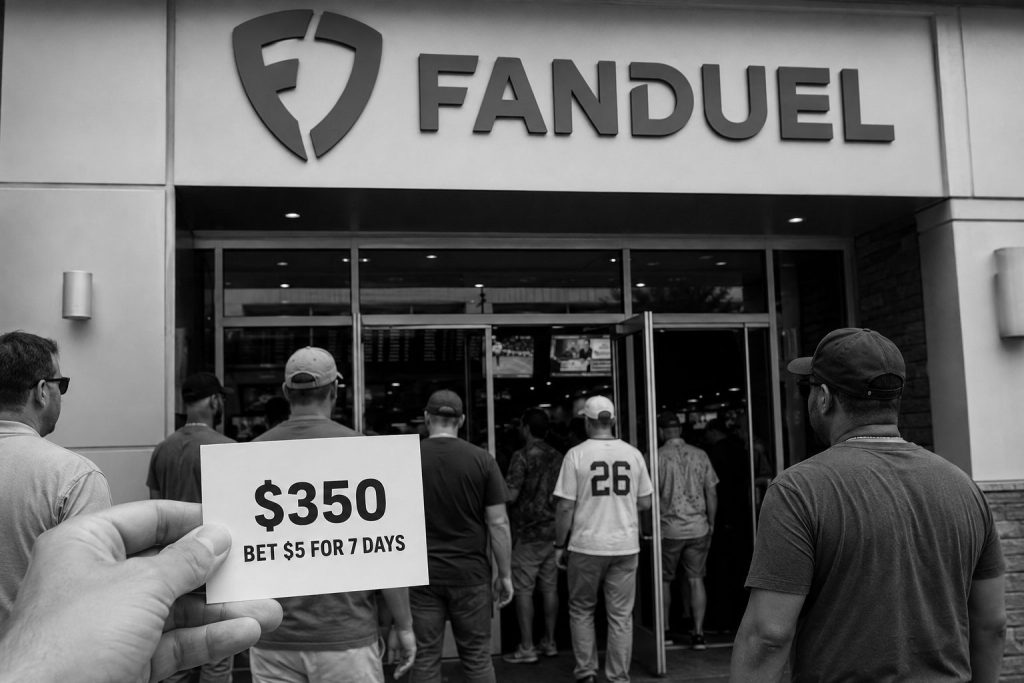
NEW YORK, August 30, 2026, 06:01 – Flutter shares rose 7.1% after its FanDuel unit introduced a $350 new customer bonus, underscoring increasing competition…
The funnel expanded, but each dollar of handle produced less net revenue. Retention after the seven-day offer is the key return metric.
Implied promotional spend equals reported 5.4% of $11.96B handle; it is not a separately reported expense.
| Metric | Q2 2026 | Q2 2025 | Signal |
|---|---|---|---|
| Total revenue | $1.683B | $1.791B | -6% |
| Sportsbook revenue | $1.039B | $1.219B | -15% |
| iGaming revenue | $577M | $507M | +14% |
| Sales & marketing | $353M | $219M | +61% |
| Adjusted EBITDA | $119M | $400M | -70% |
| Adjusted EBITDA margin | 7.1% | 22.3% | -15.2pp |
| Consensus | Overweight |
| Buy / Overweight / Hold / Sell | 23 / 2 / 9 / 1 |
| Average target | $135.26 |
| Implied upside | 32.9% |
| 52-week range | $89.71–$300.92 |
| Friday volume / average | 1.03× |
Risks: bonus churn, sports outcomes, higher state taxes, prediction-market competition and management transition.
FanDuel can spend $350 to create attention. Flutter's return depends on repeat wagering after the seventh day while promotional intensity retreats from 5.4% of handle.
Sources: FanDuel promotions; Flutter Q2 2026 SEC exhibit; Google Finance; FactSet via WSJ; NFL Football Operations. Figures rounded.
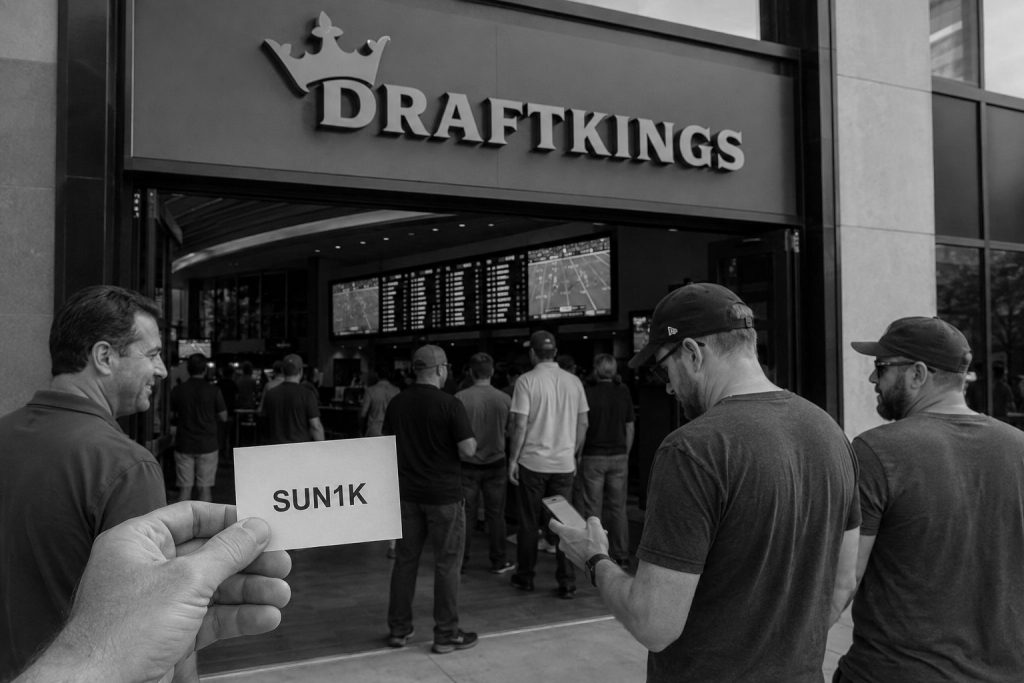
Interest in “draftkings bonus code” increased over the weekend as DraftKings Inc. advertised a deposit match offer aimed at new customers ahead of football’s…
Sales and marketing rose $89.3M while quarterly revenue declined $69.3M.
| Metric | Q2 2026 | Q2 2025 | Investor signal |
|---|---|---|---|
| Revenue | $1.443B | $1.513B | -4.6% |
| Sales & marketing | $322.5M | $233.2M | +38.3% |
| Adjusted EBITDA | $114.6M | $300.6M | -61.9% |
| Adjusted EBITDA margin | 7.9% | 19.9% | -12.0pp |
| Sports consumer volume | $13.1B | $11.5B | +15% |
| Consensus rating | Moderate Buy |
| Buy / Hold / Sell | 30 / 8 / 2 |
| Average target | $34.11 |
| Implied upside | 35.0% |
| 52-week range | $20.46–$48.78 |
| Friday volume / average | 1.64× |
Risks: bonus churn, customer-friendly outcomes, higher taxes, regulation and competing offers can keep acquisition costs elevated.
DraftKings can buy attention before football season. The stock case now depends on converting that attention into repeat betting while moving marketing below 22% of revenue and recovering margin.
Sources: DraftKings official promotions; DraftKings Q2 2026 Form 10-Q and earnings release; Google Finance; MarketBeat; NFL Football Operations. Figures may differ slightly due to rounding.
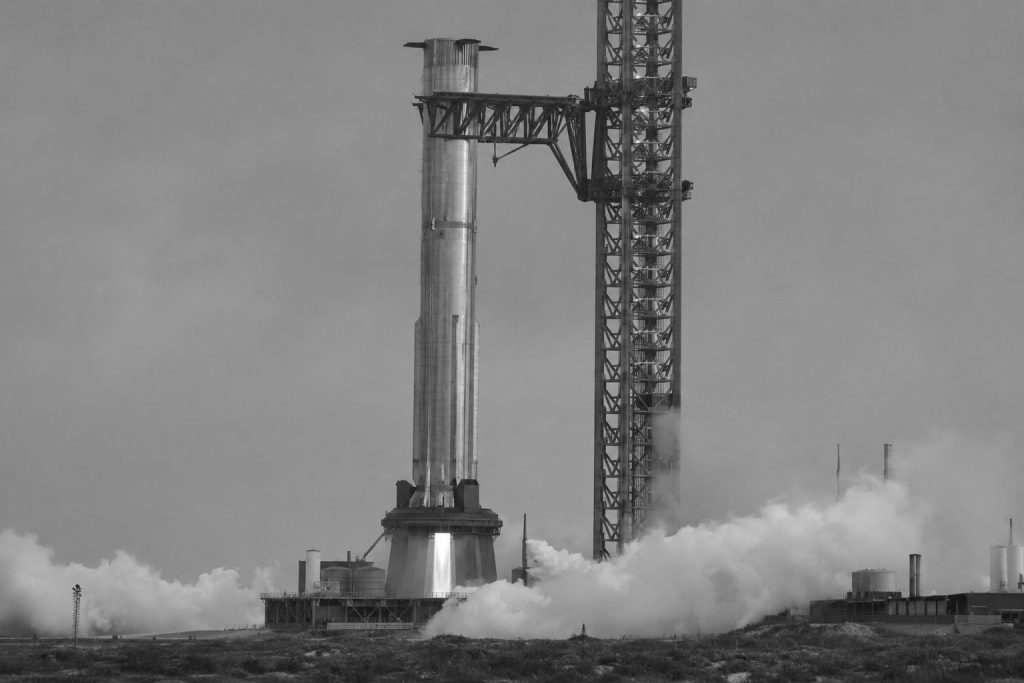
SpaceX has moved Starship Flight 14 into September after completing a full-duration static fire of Booster 21. The schedule shift turns a rocket test…
Orbital capability is the bridge between experimental hardware and scalable capacity.
Flight 14 combines the first orbital trajectory, a viable payload and a possible Ship 41 tower catch. Success would lower three uncertainties at once: performance, reuse and deployment capacity.
| Test | Flight 13 result | Flight 14 objective | Financial signal |
|---|---|---|---|
| Trajectory | Suborbital | First orbital flight | Broadens commercial launch utility |
| Payload | Upgraded Starlink deployment | Viable orbital payload | Links vehicle to revenue capacity |
| Ship recovery | Soft splashdown; later recovered | Possible tower catch | Tests rapid reuse |
| Booster | Landing-burn failure | V3 Booster 21 | Execution risk remains visible |
Booster 21 proof campaign
Structural and tank validation.
33-engine static fire
Full booster propulsion test.
Ship 41 campaign
Complete testing and pad work.
Stack + notices + FAA
No firm launch date confirmed.
At about 59 times annualized Q2 revenue, the market assumes Starship becomes more than a development program. Flight 14 can reduce that execution discount by proving orbit, payload delivery and recoverability in one mission.
What changes the view: Ship 41 static fire, vehicle stacking, FAA operational approval and SpaceX launch confirmation.
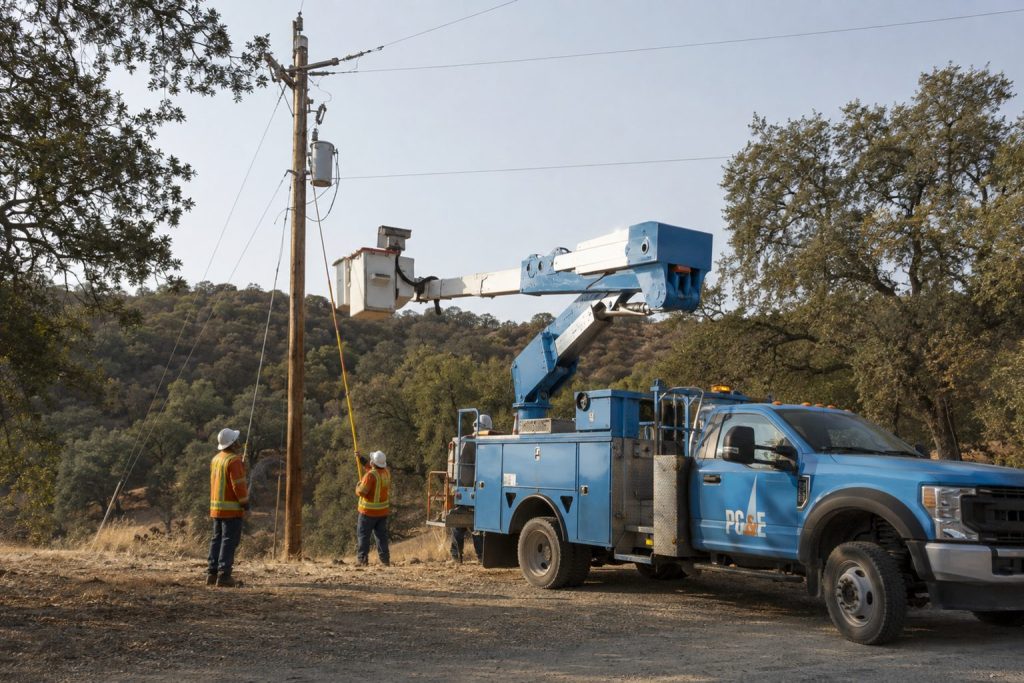
OAKLAND, California, August 30, 2026, 03:05 – PG&E shares tumbled 7.5% after efforts to resolve the company’s wildfire liability broke down, erasing about $3…
Core earnings rose 36% year over year.
Friday's drop was larger than the change in near-term earnings. The market repriced the probability and severity of future wildfire claims. A durable rerating requires clearer liability rules alongside continued safety execution.
Wildfire claimsSubrogationRegulationFinancing costA catastrophic fire, adverse causation finding, regulatory disallowance or reduced access to wildfire-fund support could outweigh ordinary utility earnings growth. Conversely, renewed liability reform could reverse part of Friday's discount.
Intel Corporation shares fell 2.85% Friday as investors weighed promising Intel 14A manufacturing data against a still-heavy foundry loss.
Quarter ended June 27, 2026.
| Measure | Q2 2026 |
|---|---|
| Revenue | $5.77B |
| Revenue growth | +31% YoY |
| Operating loss | $2.09B |
| Loss / revenue | 36.2% |
| Prior-year loss | $3.17B |
| Total revenue | $16.1B · +25% |
| DCAI revenue | $6.3B · +59% |
| Client revenue | $8.9B · +13% |
| Non-GAAP gross margin | 41.8% |
| Operating cash flow | $7.0B |
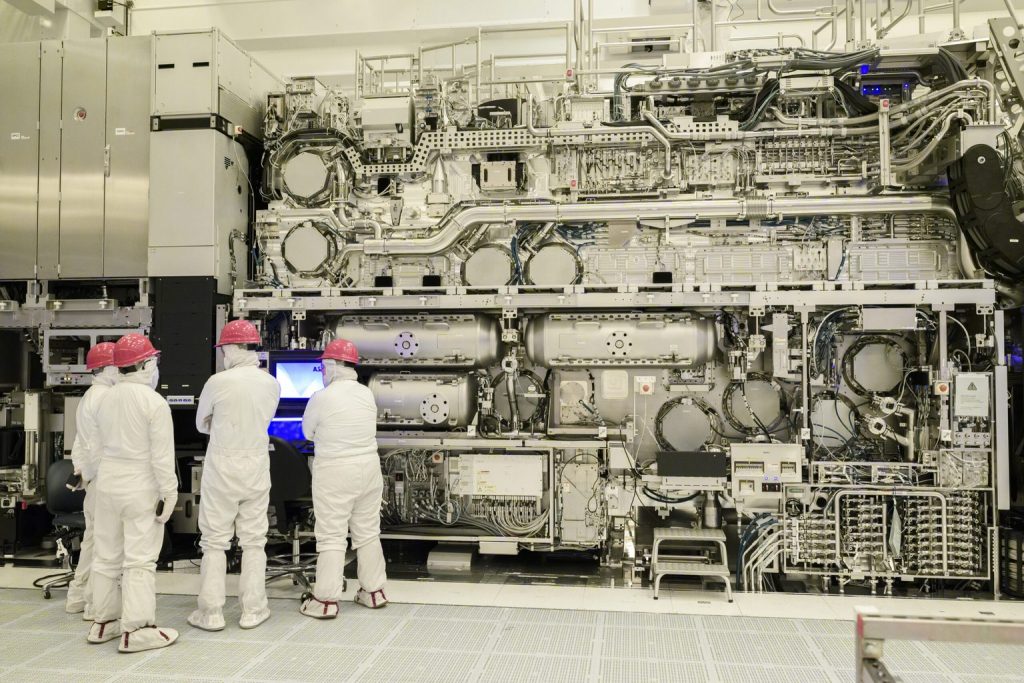
Intel 14A combines second-generation RibbonFET transistors, PowerDirect backside power delivery and High-NA EUV. The architecture can improve density and power efficiency, but defect data must convert into repeatable yield and customer volume.
Defect density is not the same as finished-die yield. The 2028 schedule leaves execution risk. Expensive lithography tools raise depreciation. External commitments remain essential for acceptable returns on 14A investment.
The 14A defect curve is Intel's strongest manufacturing signal in years. Yet the market still sees a $2.09 billion quarterly Foundry loss and a two-year runway to volume production. The next re-rating requires named external customers, disclosed capacity commitments and evidence that yield gains reduce cost per good die.
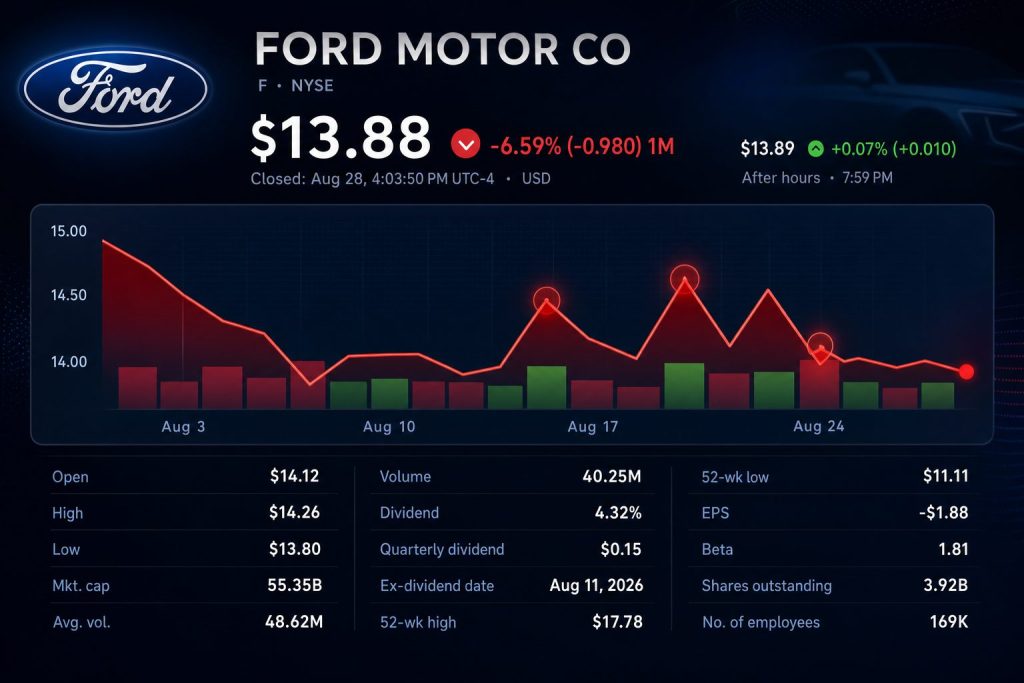
DEARBORN, Michigan, August 30, 2026, 01:10 – Ford Motor Co. shares dipped by 0.5% as the prospect of tariffs from Canada put pressure on…
| Measure | Aug. 28 |
|---|---|
| Ford | -0.50% |
| Automotive group | -1.78% |
| S&P 500 | -0.25% |
| 52-week range | $11.11-$17.78 |
| Market value | $55.34B |
The yield is attractive only if Ford converts guidance into cash after tariff, warranty and EV spending pressures.
| Indicator | Current |
|---|---|
| Consensus | Overweight |
| Buy / Overweight | 8 |
| Hold | 13 |
| Underweight / Sell | 2 |
| Target range | $11-$20 |
U.S.-Canada trade talks stalled over autos. Washington has threatened 50% tariffs on Canadian vehicles and parts from Jan. 1, 2027. The dispute raises sourcing and production risk across North American supply chains.
| Q3 EPS estimate | $0.41 |
| Three months ago | $0.37 |
| Q2 adjusted EBIT | $2.5B |
| Quarter-end liquidity | $43.4B |
Ford's 7.5x forward earnings multiple and double-digit guided cash-flow yield offer valuation support. The market is demanding proof that Ford Pro and Ford Blue can absorb Model e losses, special charges and renewed tariff pressure. A clean Q3 cash conversion would narrow that discount; weaker margins would justify it.
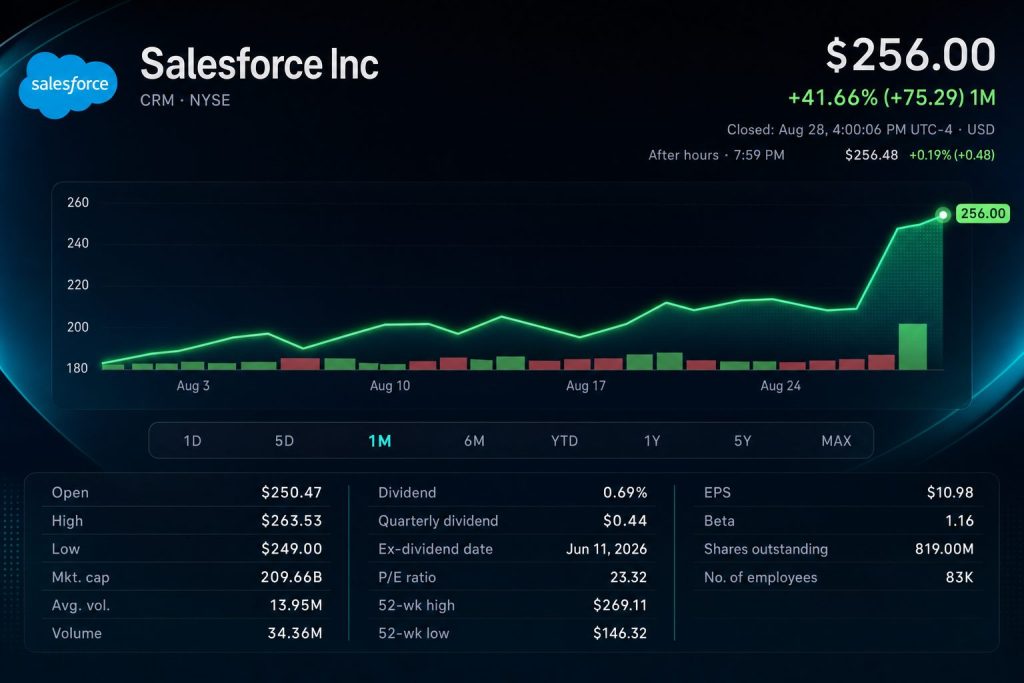
Salesforce Inc. advanced 1.6% on Friday. Volume hit 34.4 million shares, roughly 2.3 times the stock's recent average. Shares ended the session at $256.00,…
| Company | Close | Move | Market cap | P/E |
|---|---|---|---|---|
| Salesforce | $256.00 | +1.6% | $210.2B | 23.5× |
| ServiceNow | $144.71 | +4.5% | $149.7B | 89.3× |
| Workday | $204.72 | +5.6% | $50.4B | 41.4× |
| Adobe | $291.52 | +0.8% | $117.3B | 16.7× |
Agentforce and Data 360 ARR approached $3.9 billion and grew more than 210%. Yet Informatica supplied $456 million and more than four points of quarterly revenue growth. The next leg depends on converting AI usage into organic subscription expansion.
The headline adjusted EPS included a $2.53-per-share investment gain. Informatica complicates organic comparisons. Investment values can reverse, while slower Agentforce monetization could compress a multiple that now sits close to the average analyst target.
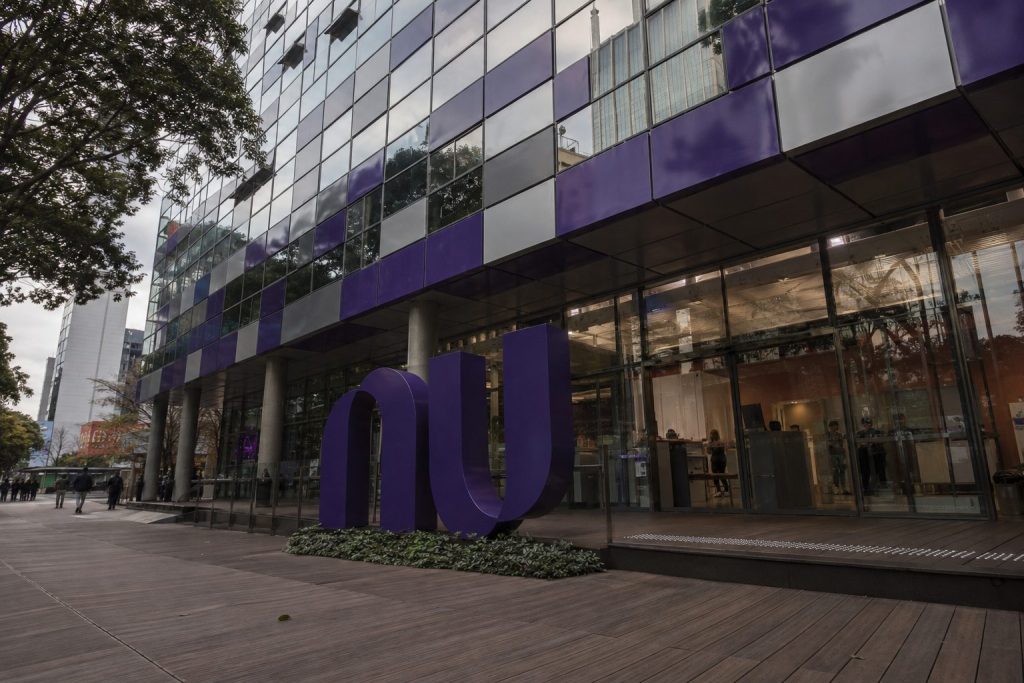
Nu Holdings dropped 3.9% on Friday to finish at $14.30, wiping out roughly $2.8 billion in market capitalization. Trading volume was 79.14 million shares.
| Metric | Q2 2026 | Reference |
|---|---|---|
| Revenue | $5.88B | $5.60B est. |
| Net income | $1.06B | $967.2M est. |
| Risk-adjusted NIM | 12.4% | 9.9% Q2’25 |
| Cost of credit | $1.69B | −9% QoQ |
| Monthly ARPAC | ≈$17 | up QoQ |