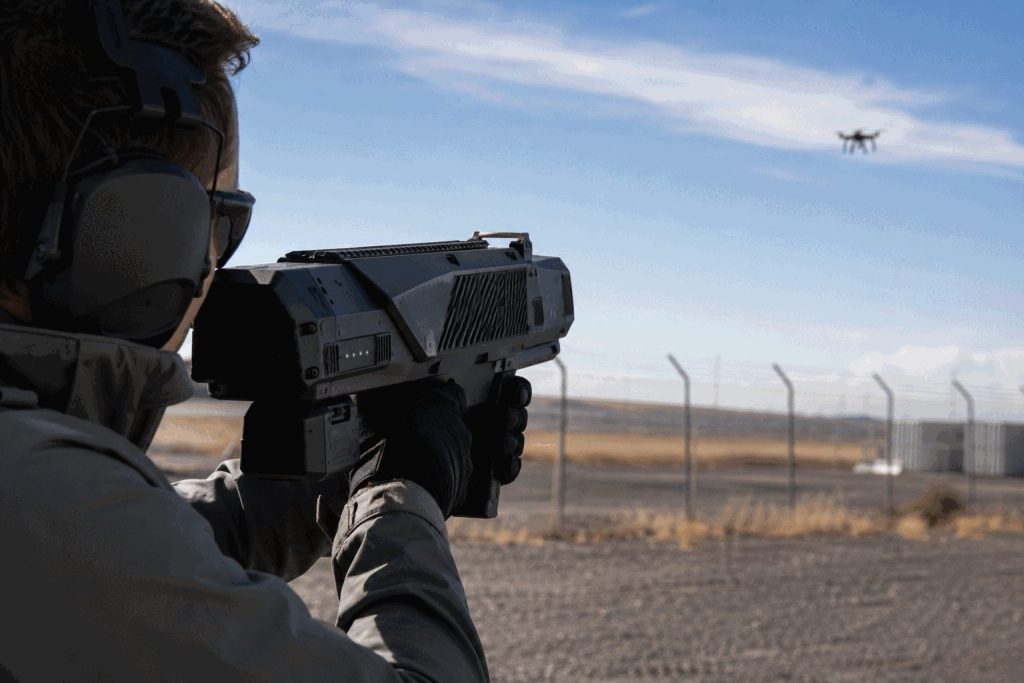
ASX:DRODefense Technology
DroneShield Shares Slide 9.4% Despite 74% Sales Increase as Net Loss Reaches A$32.2 Million
Shares in DroneShield Limited dropped 9.4% on Wednesday, finishing at A$1.768 as higher first-half costs offset its record sales.
Market intelligence
Fast, evidence-led coverage of the companies and events moving global markets.
All coverage
Shares in DroneShield Limited dropped 9.4% on Wednesday, finishing at A$1.768 as higher first-half costs offset its record sales.
| A$ million | 1H25 | 1H26 | Change |
|---|---|---|---|
| Revenue | 72.3 | 125.8 | +74% |
| Recurring revenue | 3.5 | 11.5 | +229% |
| Gross margin | 65.3% | 60.0% | −5.3 pts |
| Underlying EBITDA | 8.0 | −12.4 | −20.4 |
| Statutory NPAT | 2.1 | −32.2 | −34.3 |
Pre-results average target from five analysts. Consensus: Buy, but the split is wide at three Buy and two Sell ratings.
High A$5.00Low A$1.60Canaccord A$2.804 Aug snapshotGross margin recovery, second-half EBITDA, delivery timing and recurring revenue. Governance remains material while ASIC examines historical disclosures and trading.
15.7% short interestInventoryProduct mixASICSources: DroneShield first-half 2026 results and investor relations; Visible Alpha consensus via Capital Brief; market and analyst data from Investing.com and S&P Global. Market figures timestamped 26 Aug 2026, 16:12 AEST. Calculations are estimates using reported shares outstanding.
ASUS launched U.S. preorders for the ROG Xbox Ally X20 at $1,299. Shares of ASUSTeK Computer Inc., the parent company, gained 4.97% to NT$971…
| Signal | Latest | Change / context | Investor read-through |
|---|---|---|---|
| Q2 brand revenue | NT$241.1B | +39% YoY | Premium products support growth |
| Q2 operating profit | NT$19.6B | +230% YoY | Strong operating leverage |
| Gross margin | 16.5% | +4.1 pts YoY | Mix is financially material |
| High-value mix | >65% | Q2 revenue share | X20 fits stated strategy |
| X20 display | 7.4-inch OLED | 1080p · 120Hz | Supports 30% price premium |
| Processor | Ryzen AI Z2 Extreme | 8 cores · 50 TOPS NPU | Matches prior Ally X silicon class |
ASUS disclosed no preorder count, production target or product margin. A limited edition can lift average selling price without moving total revenue. Component inflation, premium-handheld competition and weak conversion after October 15 are the key measurable risks.
NEW YORK, August 26, 2026, 07:34 — U.S. Treasury yields moved up as investors await $4 billion in scheduled buybacks and focus on upcoming…
2-, 5- and 20-year: August 25 close. 10- and 30-year: August 26, 07:20 EDT.
| Measure | June | July consensus |
|---|---|---|
| Headline PCE, y/y | 3.7% | 3.6% |
| Core PCE, y/y | 3.3% | 3.3% |
| Federal Reserve goal | 2.0% | |
Buybacks can improve liquidity. They do not remove the inflation premium embedded in long-maturity yields.
| July core PCE outcome | Possible first move | Bias |
|---|---|---|
| ≤3.1% | -5 to -10 bp | Duration bid |
| 3.2%–3.4% | -3 to +3 bp | Range |
| ≥3.5% | +7 to +15 bp | Selloff risk |
Scenario ranges are analytical estimates, not forecasts. Oil and GDP revisions can amplify or offset the first reaction.
| Channel | Current signal | Exposure |
|---|---|---|
| Mortgages | 30-year fixed near 6.75% | Housing demand, banks |
| Corporate credit | 4.64% risk-free anchor | Refinancing cost |
| Equities | High discount rate | Long-duration growth |
| Pensions | 5.18% long bond | Liability values |
Mortgage estimate dated August 25, 2026. Treasury yields dated August 26, 07:20 EDT.
Retire harder-to-trade off-the-run bonds, support dealer liquidity and reduce local pricing gaps in the 10-to-30-year sectors.
Fix the primary deficit, guarantee lower yields or neutralize an upside inflation surprise. Treasury explicitly frames the program as liquidity support.
Sources: U.S. Treasury · BEA calendar · BEA core PCE · Federal Reserve H.15 · Reuters · Tradeweb via Barron's. Updated August 26, 2026, 07:35 EDT.
Bath & Body Works shares pointed down after the company’s quarterly outperformance was largely driven by a tariff refund. Bath & Body Works, Inc.…
Premarket snapshot: August 26, 2026, 07:12 EDT · Earnings data: quarter ended August 1, 2026
Stores still generated 74.7% of quarterly revenue. Direct and international growth offset about 46% of the $65 million store-sales decline.
| FY26 metric | May 27 | Aug. 26 | Change |
|---|---|---|---|
| Net-sales growth | −4.5% to −2.5% | −4.0% to −2.5% | Low end +0.5 pt |
| Adjusted EPS | $2.40-$2.65 | $2.60-$2.80 | Midpoint +6.9% |
| Adjusted gross margin | ~42.4% | ~43.3% | +90 bps |
| Free cash flow | ~$600M | ~$650M | +$50M |
| Capital spending | ~$270M | ~$240M | −$30M |
| Equity value | ~$3.48B |
| FY26 adjusted P/E | ~6.4× midpoint |
| FY26 free-cash-flow yield | ~18.7% |
| Annual dividend yield | ~4.6% |
| 52-week range | $14.28-$32.32 |
Calculated with $17.27, 201.56 million shares, $2.70 adjusted EPS midpoint and $650 million free-cash-flow guidance. No repurchases are assumed in management's outlook.
| Date | Firm | View | Target |
|---|---|---|---|
| Aug. 19 | Telsey | Hold | $22 |
| Aug. 18 | JPMorgan | Neutral | $24 |
| Aug. 18 | Citi | Buy | $25 |
| Jul. 8 | Goldman Sachs | Sell | $19 |
Consensus: Hold from 18 analysts; average target $25.33. Targets may change after the earnings call.
The report beat the company's guidance even after removing the refund. The valuation question is whether direct and international growth can offset a store channel that still supplies three-quarters of sales. The third-quarter guide keeps that test unresolved.
Sources: Bath & Body Works Q2 2026 earnings release and presentation; Yahoo Finance quotation at 07:12 EDT; StockAnalysis analyst record. Price data are indicative and may be delayed. Calculations are derived from disclosed inputs and rounded.
Shares in WiseTech Global Limited dropped 9.6% on Wednesday. The company finished at A$41.10, after reaching as low as A$40.80 during the session, market…
| US$ million | FY25 | FY26 | FY27 guide |
|---|---|---|---|
| Revenue | 778.7 | 1,395.9 | 1,480–1,540 |
| Underlying EBITDA | 413.9 | 644.5 | 725–780 |
| Underlying margin | 53% | 46% | 49%–51% |
| Statutory NPAT | 200.7 | 178.7 | — |
Average target from 16 analysts, published before the FY26 result. Consensus: Buy. Implied upside from A$41.10: 58.5%.
11 Strong Buy2 Buy3 HoldJul 2026 snapshotRevenue growth must reaccelerate after e2open's first-year step-up. Freight weakness can slow transaction revenue. Integration costs, regulatory scrutiny and restructuring may delay the 49%–51% FY27 margin target.
ACCC inquiryIntegrationFreight cycleExecutionSources: WiseTech FY26 results and investor centre; ASX-market reporting; StockAnalysis S&P Global consensus. All company financials are in U.S. dollars unless stated. Market-value change is an estimate using reported shares outstanding.
Semtech Corporation gained 4.3% ahead of the market open after projecting a stronger uptick in growth. Shares were priced at $133.00 at 06:30 EDT,…
A record quarter matters. The larger signal is a $410 million revenue guide that sits 14% above consensus, supported by 91% data-center growth and expanding margins.
NASDAQ: SMTCUpdated August 26, 2026, 06:32 EDT| Metric | Reported | Comparison |
|---|---|---|
| Revenue | $341.9M | +33% YoY; 4.0% beat |
| Adjusted EPS | $0.71 | +73% YoY; 16.4% beat |
| Adjusted gross margin | 54.5% | +130 bps QoQ |
| Adjusted operating margin | 24.4% | +560 bps YoY |
| Free cash flow | $61.4M | +48% YoY |
| Engine | YoY growth |
|---|---|
| Data center | +91% |
| Infrastructure | +69% |
| LoRa-enabled | +58% |
| IoT Systems and Connectivity | +11% |
| Measure | Q2 FY2026 | Q1 FY2027 | Q2 FY2027 | Q3 guide |
|---|---|---|---|---|
| Adjusted gross margin | 53.2% | 53.0% | 54.5% | 58.3% ±100 bps |
| Adjusted operating margin | 18.8% | 20.4% | 24.4% | ≈31.0% midpoint calculation |
| Adjusted gross margin excluding held-for-sale unit | — | — | — | 63.9% ±100 bps |
The held-for-sale cellular-module business generated $48.1 million of Q2 revenue and $10.9 million of adjusted gross profit. Its implied 22.7% margin diluted the consolidated profile.
Semtech beat the completed quarter, but the forward numbers moved the valuation. The $410 million revenue midpoint stands 14% above consensus. The $1.05 adjusted-EPS midpoint is 44% higher. Data-center revenue growth and the planned removal of a low-margin unit make the margin expansion measurable.
Premarket liquidity remains thin. The forecast depends on bookings becoming shipments on schedule. Hyperscaler demand, customer concentration and limited supplier capacity can move timing between quarters. A high-growth valuation also leaves less room for execution errors.
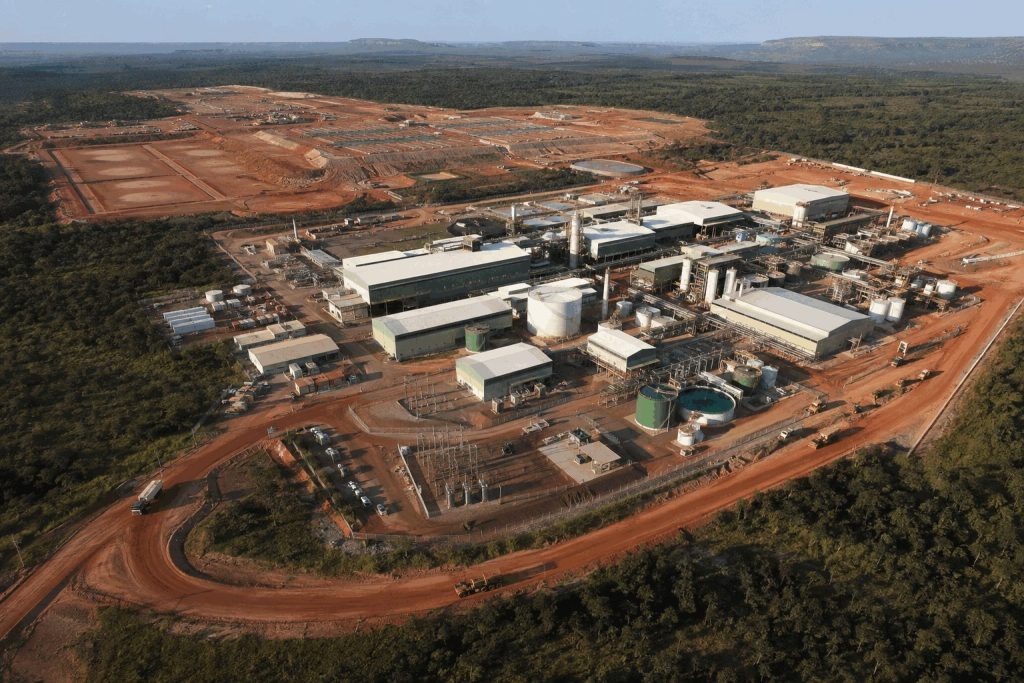
Shares of USA Rare Earth rose further in premarket trading on Wednesday. The company secured funding for a government-supported entity set to purchase all…
The $1.55 billion SPV supports Serra Verde’s output. Friday’s vote tests whether that protection offsets dilution.
Daily closes through Aug. 25, plus the Aug. 26 premarket quote. U.S. dollars.
The financing announcement leads directly into the vote.
The SPV completed a $1.55 billion capitalization package for 100% of Serra Verde’s Phase 1 production.
USAR rose 6.12%. Northland maintained Buy and a $45 target.
Stockholders vote on issuing the shares needed for the Serra Verde acquisition.
Management expects closing after remaining conditions are satisfied or waived.
Approval removes one hurdle. It does not by itself confirm closing, integration, output or cash generation.
Share of USAR’s $4.75 billion market value at the Aug. 25 close.
The SPV buys product. Its funding is not a $1.55 billion deposit into USA Rare Earth’s corporate account.
Serra Verde consideration at the $19.90 premarket share price.
The funding lowers customer and pricing risk. The stock issuance transfers a large part of the combined equity to Serra Verde’s owners.
Quarter ended June 30, 2026.
| Metric | Reading | Investor use |
|---|---|---|
| Cash | $1.53B | 32.2% of market value |
| Q2 revenue | $5.82M | Early commercial base |
| Q2 gross loss | $1.58M | Costs exceeded product revenue |
| Q2 operating loss | $46.31M | Build-out spending |
| H1 operating cash use | $75.32M | Pre-acquisition burn |
| H1 capex + deposits | $108.39M | Expansion investment |
Cash was raised largely through a $1.5 billion PIPE. Serra Verde adds operations, debt and integration costs.
Targets available Aug. 25, 2026; change versus the $19.41 close.
| Reference | Target | Implied move |
|---|---|---|
| Northland | $45.00 | +131.8% |
| S&P Global high | $45.00 | +131.8% |
| S&P Global average | $37.38 | +92.6% |
| S&P Global low | $30.00 | +54.6% |
STRONG BUY Eight-analyst S&P Global consensus. Targets are opinions, not forecasts.
Aug. 25 cash-session moves; the whole group participated.
| Company | Ticker | Move |
|---|---|---|
| Critical Metals | CRML | +21.44% |
| USA Rare Earth | USAR | +6.12% |
| MP Materials | MP | +4.79% |
| United States Antimony | UAMY | +1.96% |
The peer bid matters. USAR’s funding and Friday vote remain company-specific.
What could break the current valuation case.
Intuit shares dropped 11.66% ahead of Wednesday’s market open after the company’s full-year forecast came in below analyst projections. Intuit Inc. was trading at…
| Measure | Guide | Street | Gap |
|---|---|---|---|
| FY27 revenue | $23.279B–$23.512B | $23.72B | −$324.5M* |
| Q1 revenue | $4.294B–$4.313B | $4.36B | −$56.5M* |
| FY27 adj. EPS | $22.88–$23.12 | $27.32 | basis shift |
| Business | FY26 | FY27 | Signal |
|---|---|---|---|
| Company | +14% | +9%–10% | slower |
| TurboTax | +7% | +2%–3% | pricing reset |
| Consumer Group | +11% | +4%–6% | volume focus |
| Credit Karma | +20% | +11%–13% | normalizing |
| Mailchimp | not disclosed | −1% to 0% | drag |
| Global Business Solutions | +16% | +13%–14% | resilient |
| FY26 revenue | $21.448B | +14% |
| Q4 revenue | $4.354B | beat $4.27B estimate |
| Cash and investments | $7.2B | Aug. 25 release |
| FY26 repurchases | $5.5B | share count −2% |
| Remaining authorization | $7.9B | Aug. 25 release |
Bull case: lower entry pricing restores filer growth, while TurboTax Live keeps mix and service revenue rising.
Bear case: discounts reduce revenue per customer before volumes respond. Flat Mailchimp sales deepen the drag.
Accounting watch: fiscal 2027 adjusted EPS includes a $5.81 share-based-compensation impact. Prior periods excluded it.
Marvell Technology, Inc. rose 4.84% to $240.38 on Tuesday. Price targets were increased by Susquehanna and Rosenblatt ahead of the company’s earnings scheduled for…
A 4.84% rally prices faster AI growth before Thursday's earnings.
Aug. 25 close
$240.38
+$11.09 · +4.84%
NASDAQ close, Aug. 25, 2026, 16:00 EDT
Premarket
$240.85
+0.20%
Delayed quote, Aug. 26, 2026, 05:01 EDT
Market value
$210.52B
Tuesday added about $9.7B
MarketWatch, Aug. 25 close
Volume
21.35M
53% of 65-day average
Aug. 25 regular session
The purchases are discretionary. The $120 billion figure is a warrant-vesting ceiling, not booked revenue or guidance.
Targets: $265, $267.82 and $300. The consensus covers 44 analysts and carries a Strong Buy rating.
A 10% move equals roughly $21 billion of market value, or 7.8 times the Q2 revenue guide.
| Measure | Latest |
|---|---|
| Q1 FY2027 revenue | $2.418B · +28% |
| Data Center revenue | $1.83B · +27% |
| Data Center share | 76% |
| Non-GAAP gross margin | 58.9% |
| Operating cash flow | $638.8M |
| Q2 revenue guide | $2.70B ±5% |
| Q2 adjusted EPS guide | $0.93 ±$0.05 |
| Term | Figure |
|---|---|
| Maximum warrant shares | 58.97M |
| Exercise price | $206.58 |
| Discount to Aug. 25 close | 14.1% |
| Potential gross proceeds | $12.18B |
| Current-share equivalent | 6.7% |
| Purchase vesting window | FYQ3 2027–FY2033 |
| Average annual threshold | About $18.5B |
Sources: market dataGoogle agreement 8-KQ1 resultsanalyst consensusearnings schedule. Calculations use company filings and the Aug. 25 close.
SAN JOSE, California, August 26, 2026, 05:32 EDT — Zoom Video Communications dropped 5.8% in premarket trade after it projected quarterly earnings per share…
The market is discounting stronger enterprise and AI adoption because third-quarter adjusted EPS guidance missed consensus and cash generation softened.
NASDAQ: ZM Updated August 26, 2026, 05:32 EDT| Q2 FY2027 metric | Value | YoY |
|---|---|---|
| Total revenue | $1.277B | +4.9% |
| Enterprise revenue | $787.5M | +7.8% |
| Online revenue | $489.7M | +0.6% |
| Enterprise mix | 61.7% | Calculated |
| Metric | Latest | Investor read |
|---|---|---|
| Non-GAAP operating margin | 40.0% | High profitability |
| Free cash flow | $472.4M | −7.0% YoY |
| Operating cash flow | $494.8M | −4.1% YoY |
| Enterprise expansion | 99% | One-point improvement; slight contraction remains |
| >$100K customers | 4,625 | +8.2% YoY |
| Virtual Agent customers | +256% YoY | Adoption disclosed; revenue not disclosed |
| Measure | Company range | Midpoint / calculation |
|---|---|---|
| Q3 FY2027 revenue | $1.275B–$1.280B | $1.2775B |
| Q3 adjusted EPS | $1.46–$1.48 | $1.47; 2.0% below consensus |
| FY2027 revenue | $5.085B–$5.095B | $5.090B |
| FY2027 adjusted EPS | $6.08–$6.12 | $6.10 |
| FY2027 free cash flow | $1.780B–$1.820B | $1.800B |
| Forward FCF yield | — | ≈6.3% at $28.54B equity value |
Extended-hours liquidity can exaggerate price moves. Microsoft Teams and Google Meet remain bundled competitors. Zoom's AI customer growth is encouraging, but product revenue was not disclosed. Strategic-investment gains also make GAAP earnings less comparable with operating performance.
NEW YORK, August 26, 2026, 05:20 EDT — Take-Two Interactive’s projected $8.2 billion in bookings comes into focus as the gaming giant prepares for…
| Units | Standard | Ultimate |
|---|---|---|
| 10M | $0.80B | $1.00B |
| 25M | $2.00B | $2.50B |
| 50M | $4.00B | $5.00B |
| Buy / Hold / Sell | 27 / 0 / 1 |
| Average target | $286.89 |
| Implied upside | 23.2% |
| Low / High | $170 / $368 |
CRISPR Therapeutics AG rose 6.70% before a late-breaking CTX310 presentation. The stock closed Tuesday at $60.90. Volume reached 2.08 million shares.
Investors paid for clinical optionality before the August 28 durability update.
Daily closes, Aug. 17–25, 2026. The latest move recaptured the prior week's high.
The valuation test shifts from anticipation to durability.
Citizens kept an $80 target. CRSP closed 6.70% higher on 1.24× average volume.
Late-breaking ESC presentation. The scheduled 10:30 EDT session covers Phase 1a CTX310 durability.
Management expects another CTX310 update as Phase 1b evaluates additional patients and dose selection.
Can one-time ANGPTL3 editing preserve lipid reductions without new safety signals? Durable effects would strengthen the cardiovascular-platform case. Short-lived effects would weaken it.
Mean reductions at the highest tested dose in initial Phase 1 data; investigational treatment, not an approved product.
Maximum individual reductions were 89%, 84% and 87%, respectively. Initial analysis covered 15 participants with average follow-up of at least 60 days. No treatment-related serious adverse events or grade 3-or-higher liver-transaminase changes were reported.
Reported for the quarter ended June 30, 2026.
The 26-quarter figure is a mechanical ratio, not management guidance. Clinical spending, milestones and working capital will change the actual runway.
Targets available Aug. 25, 2026; upside or downside versus the $60.90 close.
| Reference | Target | Implied move |
|---|---|---|
| Citizens | $80.00 | +31.4% |
| S&P Global average | $87.56 | +43.8% |
| S&P Global median | $80.00 | +31.4% |
| S&P Global low | $44.00 | −27.8% |
BUY S&P Global consensus across 22 analysts. Targets are opinions, not forecasts.
Vertex leads commercialization; economics are shared with CRISPR Therapeutics.
Vertex and CRISPR Therapeutics share CASGEVY profits and costs 60%/40%. The approved therapy provides commercial validation, but CTX310 has a different delivery method, target and risk profile.
The stock move came before detailed durability data.
Advanced Micro Devices stock rose 4.91% on Tuesday as Raymond James raised its rating on the chipmaker to Strong Buy. Advanced Micro Devices, Inc.…
Server-CPU optimism met a valuation already priced for rapid data-center growth.
Aug. 25 close
$479.18
+$22.44 · +4.91%
NASDAQ close, Aug. 25, 2026, 16:00 EDT
Premarket
$480.48
+0.27%
Delayed quote, Aug. 26, 2026, 04:35 EDT
Market value
$782.25B
Estimated daily gain: $36.6B
Based on Aug. 25 close and reported shares
Trading activity
19.0M
67% of 65-day average
Aug. 25 session
Raymond James: Strong Buy, $641 target, raised from $565. Consensus: Moderate Buy, $553.72 average across 46 analysts.
Calculations use a $782.25 billion market value at $479.18. Rounded figures may not sum precisely.
| Q2 2026 measure | Result |
|---|---|
| Total revenue | $11.54B · +50% |
| Data Center revenue | $6.72B · +107% |
| Data Center operating income | $2.10B |
| Calculated segment margin | 31.3% |
| Non-GAAP gross margin | 56% |
| Q3 revenue guide | $13.0B ± $0.3B |
Raymond James estimates server-processor revenue can grow 44% annually to $201 billion in 2030. It attributes $168 billion of that market to AI demand.
The thesis is narrower than AMD's reported Data Center segment. That segment combines server CPUs and AI accelerators, so disclosed revenue does not isolate the upgraded product line.
AMD has gained 123.8% in 2026. It remains about 18% below its 52-week high of $584.73 and trades near 123 times trailing earnings.
Sources: AMD Q2 resultsAMD price historyRaymond James upgrade reportanalyst consensusmarket data. Market figures timestamped above.
SANTA CLARA, California, August 26, 2026, 04:53 EDT – Shares of AMD climbed 4.9% after the company's server-CPU market forecast increased by $37 billion,…
| Metric | Latest | Change / benchmark | Reading |
|---|---|---|---|
| Q2 revenue | $11.5B | +50% YoY | Record |
| Data Center revenue | $6.7B | More than doubled | Core bull case |
| Q3 revenue guide | $13.0B ± $0.3B | Consensus was $12.52B | Above Street |
| Q3 adjusted gross margin | 56% | Flat with Q2 | Scale must offset mix |
| Trailing P/E | ≈123× | Premium valuation | Execution-sensitive |
| Consensus target | $553.72 | +15.6% | Below Raymond James |
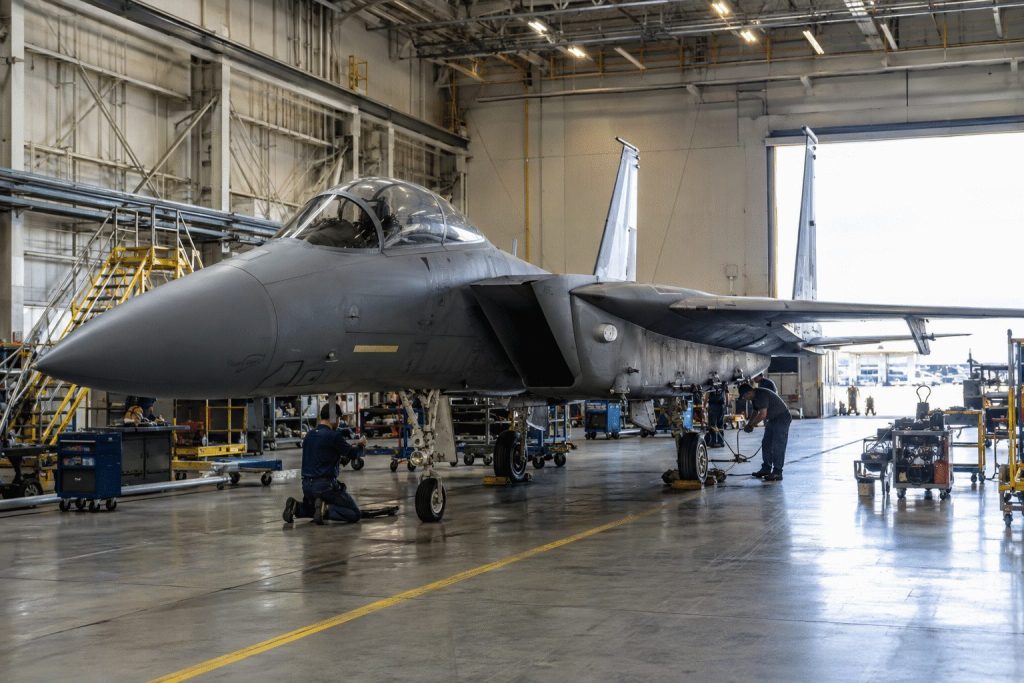
The Boeing Company shares ended 0.29% higher Tuesday after the U.S. Air Force awarded Boeing a ceiling contract worth $131.23 billion for its F-15…
| Q2 BDS revenue | $7.483B | +13% YoY |
| Q2 BDS operating margin | -0.2% | -1.9 pts YoY |
| BDS backlog | $85B | 27% international |
| Company cash + securities | $20.0B | Q2 end |
| Consolidated debt | $45.9B | Q2 end |
| VC-25B Q2 loss charge | $280M | Margin warning |
| Company | Latest price | Move | Market cap | P/E |
|---|---|---|---|---|
| Boeing (BA) | $211.08 | +0.29% | $166.83B | 96.1× |
| Lockheed Martin (LMT) | $556.52 | -1.35% | $128.44B | 20.5× |
| General Dynamics (GD) | $376.58 | -1.88% | $101.89B | 23.0× |
| Northrop Grumman (NOC) | $542.52 | -1.24% | $77.25B | 17.3× |
Latest feed values checked Aug. 26 at 04:39 EDT; BA close and after-hours data are timestamped Aug. 25. Peer feeds may reflect their latest available extended-hours print.
Sources: U.S. contract notice dated Aug. 24, Boeing Q2 results dated July 28, WSJ market data, MarketBeat analyst aggregation and latest market feeds. Ratios are calculated from displayed inputs. Ceiling value is not guaranteed revenue or backlog.
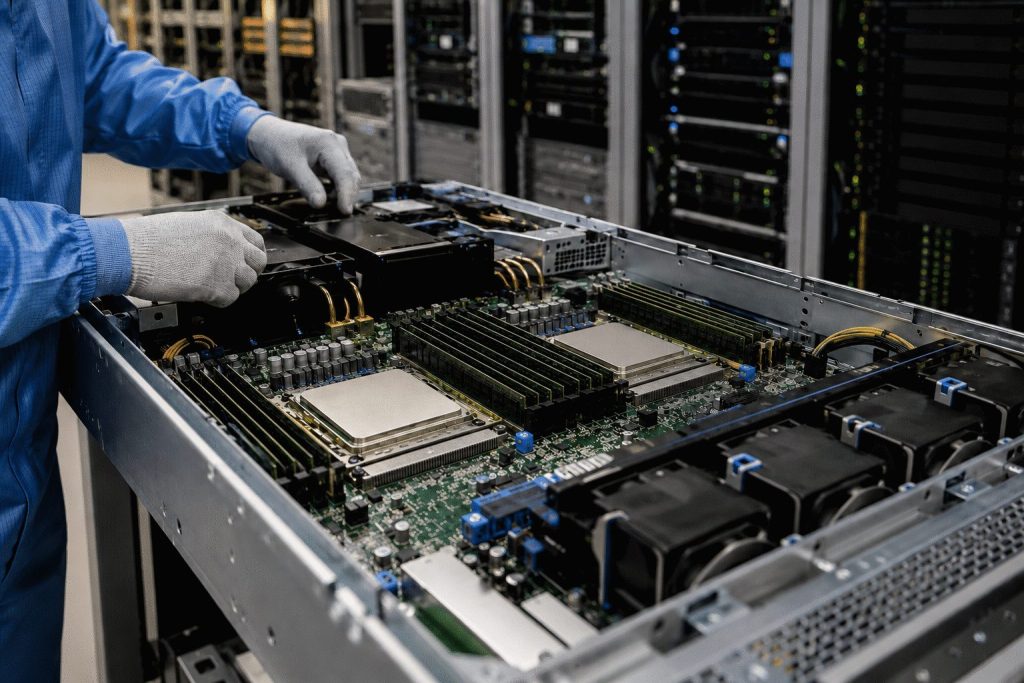
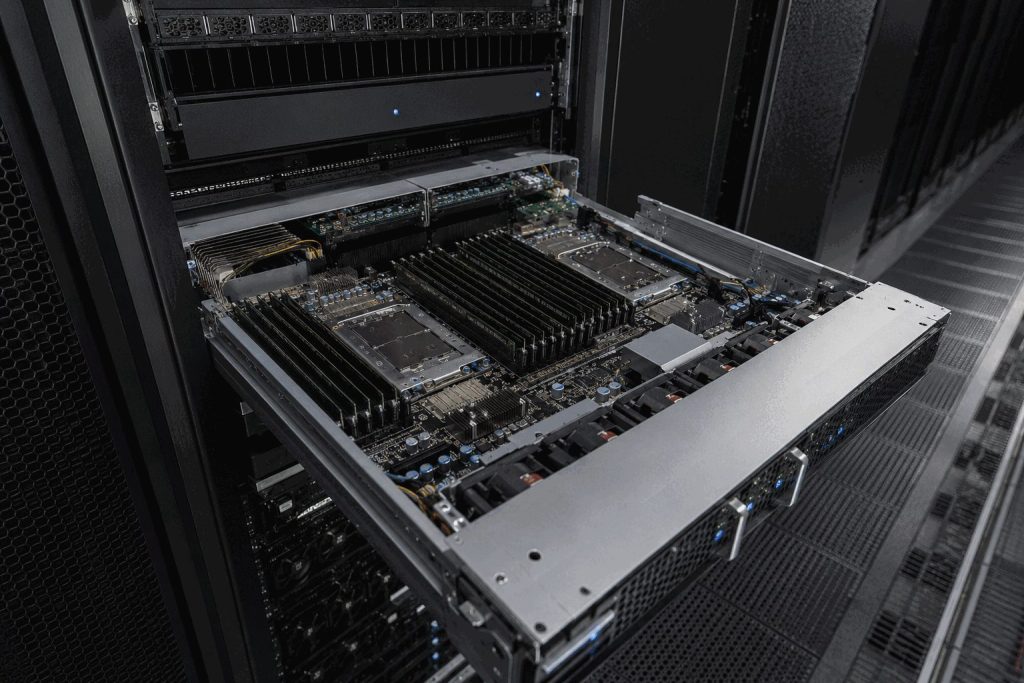
Super Micro Computer, Inc. gained 9.35% after Cisco launched an enterprise channel for its AI servers. Shares ended Tuesday at $38.46. Trading volume was…
| FY26 | Revenue | Gross margin | Net income |
|---|---|---|---|
| Q1 | $5.0B | 9.3% | $168M |
| Q2 | $12.7B | 6.3% | $401M |
| Q3 | $10.2B | 9.9% | $483M |
| Q4 | $11.1B | 17.5% | $1.18B |
| Company | Close | Daily move | Signal |
|---|---|---|---|
| Super Micro (SMCI) | $38.46 | +9.35% | Cisco channel |
| Dell (DELL) | $451.50 | +4.23% | Server peer |
| HPE (HPE) | $53.44 | +1.93% | Server peer |
| Cisco (CSCO) | $111.11 | +0.80% | Platform owner |