Gold Hits Three-Month High as $1.2 Billion GLD Inflow Faces PCE Test
Gold touched a three-month high on Tuesday as falling Treasury yields lowered its opportunity cost. The move brought $4,700 into view before profit-taking trimmed…
Market intelligence
Fast, evidence-led coverage of the companies and events moving global markets.
All coverage
Gold touched a three-month high on Tuesday as falling Treasury yields lowered its opportunity cost. The move brought $4,700 into view before profit-taking trimmed…
A three-month high met profit-taking while listed-fund demand accelerated.
Most-active futures reference series; closes shown through August 25. The month-to-date move is roughly 14%.
Gold pays no coupon. Lower Treasury yields reduce the income forgone by holding bullion.
−6.5 bp, the largest decline since June 24.
−5.6 bp to 5.174%.
| Vehicle / flow | Reading | Signal |
|---|---|---|
| GLD volume | 40.0m shares | 2.1× Monday |
| GLD turnover | ≈$17.1bn | High liquidity |
| GLD creations | $1.2bn | Fresh demand |
| Metals ETF creations | $1.3bn | GLD share ≈92% |
Turnover is price multiplied by volume; creations are reported primary-market flows.
| Asset | August 25 | Read-through |
|---|---|---|
| Spot gold | High $4,696.18 | Safe-haven bid |
| Silver | $68.86 | Near-flat |
| U.S. 10-year | 4.638% | Lower carry hurdle |
| Dollar index | Broadly steady | Yield move dominated |
| China net imports | 56.193 tonnes | +11% in July |
| Trigger | Likely gold pressure |
|---|---|
| Softer PCE, lower yields | Supportive |
| Hotter PCE, stronger dollar | Negative |
| Persistent ETF creations | Supportive |
| Geopolitical easing | Negative |
The breakout case now needs confirmation from rates and fund flows. A clean hold above $4,700 would extend August's trend. A reversal in yields would expose a crowded trade after a 14%-plus monthly gain.
Sources: Reuters gold market · Reuters cross-asset close · GLD data · ETF flows. Figures timestamped above; prices may differ by contract and venue.
SAN FRANCISCO, August 25, 2026, 16:42 EDT — Hims stock gained 2.2% after recent losses tied to a Visa dispute, though the market capitalisation…
Market data through August 25, 2026, 16:42 EDT
Closing prices; after-hours marker shown for Tuesday.
Reported dispute-rate threshold.
| Exit condition | <1.5% |
| Required duration | 3 months |
| Surcharge | $8 / dispute |
| September bill | ≈$75K |
| Implied disputes* | ≈9,375 |
*Derived by dividing $75,000 by the reported $8 surcharge; actual program billing may differ.
| Measure | Latest | Investor signal |
|---|---|---|
| Q2 revenue | $753.2M | +38% YoY |
| Subscribers | 2.891M | +19% YoY |
| Average monthly revenue / subscriber | $92 | +21% YoY |
| Visa-related reported fee | ≈$75K | Small direct cost |
| Two-session equity loss | ≈$474M | Trust risk priced |
| Q2 measure | 2026 | 2025 |
|---|---|---|
| Revenue | $753.2M | $544.8M |
| Gross margin | 64% | 76% |
| Net income / loss | -$86.3M | $42.5M |
| Adjusted EBITDA | $60.3M | $82.2M |
| Free cash flow | -$68.2M | -$69.4M |
| Q3 revenue guide | $880–900M |
| Midpoint growth QoQ | ≈18.2% |
| Q3 adjusted EBITDA | $75–95M |
| FY26 revenue | $3.1–3.3B |
| FY26 adjusted EBITDA | $275–325M |
| Set / firm | Rating | Target |
|---|---|---|
| 15-analyst consensus | Hold | $31.23 avg. |
| Consensus range | $23–$42 | -27.6% to +32.3% |
| Barclays, Aug. 21 | Equal Weight | $35 |
| Truist, Aug. 24 | Hold | $32 |
Quoted equity value to trailing revenue at Tuesday’s close.
Watch: dispute-rate remediation, refunds, subscription churn, FTC litigation, gross-margin mix and the conversion of 47%–50% guided Q3 growth into cash.
Sources: Hims & Hers Q2 2026 release and SEC filing; FTC complaint; Bloomberg details republished by Investing.com; StockAnalysis market and S&P Global analyst data. Derived figures may differ slightly because of rounding.
Robinhood Markets, Inc. surged 8.17% to close at $112.09 on Tuesday. The $8.47 increase boosted its quoted equity valuation by about $7.62 billion, calculated…
Revenue mix from Robinhood’s August 5, 2026, second-quarter release. Subcategories overlap the transaction total and therefore do not sum to total revenue.
| Metric | July 2026 | Month over month | Year over year |
|---|---|---|---|
| Equity notional | $332.8B | −15% | +59% |
| Options contracts | 324.2M | +2% | +66% |
| Crypto notional | $10.9B | −33% | −62% |
| Robinhood App crypto | $4.3B | −38% | −74% |
| Event contracts | 6.1B | −5% | +20× |
| Net deposits | $5.6B | 18% annualized rate | — |
The 76× ratio is a sensitivity marker. It shows how strongly investors linked Tuesday’s Bitcoin move to future trading activity, despite crypto’s small current share of Robinhood revenue.
A durable signal would pair stronger crypto notionals with continued deposit growth. Options, equities and event contracts would need to remain firm.
Bitcoin gave back part of its early rise. HOOD’s 49.64× trailing P/E leaves the shares exposed if activity fails to follow price.
Interactive Brokers Group, Inc. surged 5.52% on Tuesday following the announcement of a distribution agreement in South Korea. Shares finished at $98.19 before moving…
Market data through August 25, 2026, 16:49 EDT · 22:49 CEST
Interactive Brokers will provide brokerage infrastructure behind Daol Investment & Securities’ platform for eligible South Korean investors seeking global equities. The companies disclosed no fees, customer targets or launch-volume commitments.
| Metric | Q2 2026 | YoY | Investor signal |
|---|---|---|---|
| Net revenue | $1.90B | +28% | Scale |
| Commissions | $673M | +30% | Trading activity |
| Net interest income | $1.06B | +23% | Balance-sheet yield |
| Customer accounts | 5.19M | +34% | Distribution |
| Customer equity | $930.3B | +40% | Asset depth |
| DARTs | 4.82M | +36% | Monetizable volume |
| Margin loans | $108.5B | +67% | Interest income |
| Net interest margin | 1.93% | −14 bp | Rate sensitivity |
Consensus: Buy from 12 analysts. The average target implies 8.1% upside. Goldman Sachs maintained Buy on August 25. Trailing P/E was about 39 times near the close.
| DARTs | 4.426M | +27% |
| Accounts | 5.317M | +34% |
| Client equity | $906.7B | +32% |
| Margin loans | $100.7B | +49% |
| Avg. commission | $2.56 | per order |
The Daol agreement has no disclosed economics. Adoption can lag distribution announcements. A lower rate environment may pressure net interest margin. South Korean rules and cross-border market access can slow onboarding.
Sources: Interactive Brokers and Daol announcement; Interactive Brokers Q2 2026 Form 10-Q; July brokerage metrics; StockAnalysis market and analyst data. Figures are current to the timestamp shown and are not investment advice.
NEW YORK, August 25, 2026, 17:25 EDT - West Texas Intermediate crude declined 3.1%, settling at $82.36 a barrel, as expectations of increased supply…
Price and ETF figures as of August 25, 2026 close, EDT.
EIA estimates. Bypass capacity: about 4.7 million b/d through Saudi and UAE pipelines.
| Signal | Likely crude effect | Why |
|---|---|---|
| Limited sanctions enforcement | Bearish premium | No immediate barrel loss |
| Temporary shipping corridor | Bearish premium | Improves tanker access |
| Secondary sanctions on buyers | Bullish risk | Threatens export demand |
| Retaliation or traffic loss | Bullish risk | Constrains physical flows |
EIA July 2026 forecast. Brent's August 25 settlement is 8.0% above the agency's 2026 average forecast.
Producers: lower spot prices reduce near-term revenue leverage.
Consumers and transports: cheaper fuel can support margins.
Rates: lower energy inflation can ease yield pressure.
Risk: physical disruption can reverse the entire move quickly.
Nike’s NFL Rivalries lineup will extend to include eight additional teams this season, growing a merchandise series the league described as Fanatics’ top-selling launch…
| Total revenue | $46.4B · flat |
| North America | $20.5B · +5%* |
| Apparel | +4%* |
| Gross margin | 42.9% · +20bp |
| Inventory | $7.5B · flat |
| Direct digital sales | −12% |
| NFC North | Chicago · Detroit |
| Green Bay · Minnesota | |
| AFC South | Houston · Indianapolis |
| Jacksonville · Tennessee | |
| First game | Week 3: IND–HOU |
| Final debut | Week 16: CHI–GB |
| Aug. 25 close | $39.48 |
| Daily move | −3.12% |
| Volume | 41.3M |
| Prior-day volume | 18.8M |
| Analyst consensus | Hold |
| Average target | $50.66 · +28.3% |
| Launch sell-through | First 7 and 30 days |
| Restocks | Team and size depth |
| nike.com traffic | Direct-channel conversion |
| Markdowns | Price integrity |
| Licensed mix | Wholesale vs. direct |
| Repeat demand | Game-week spikes |
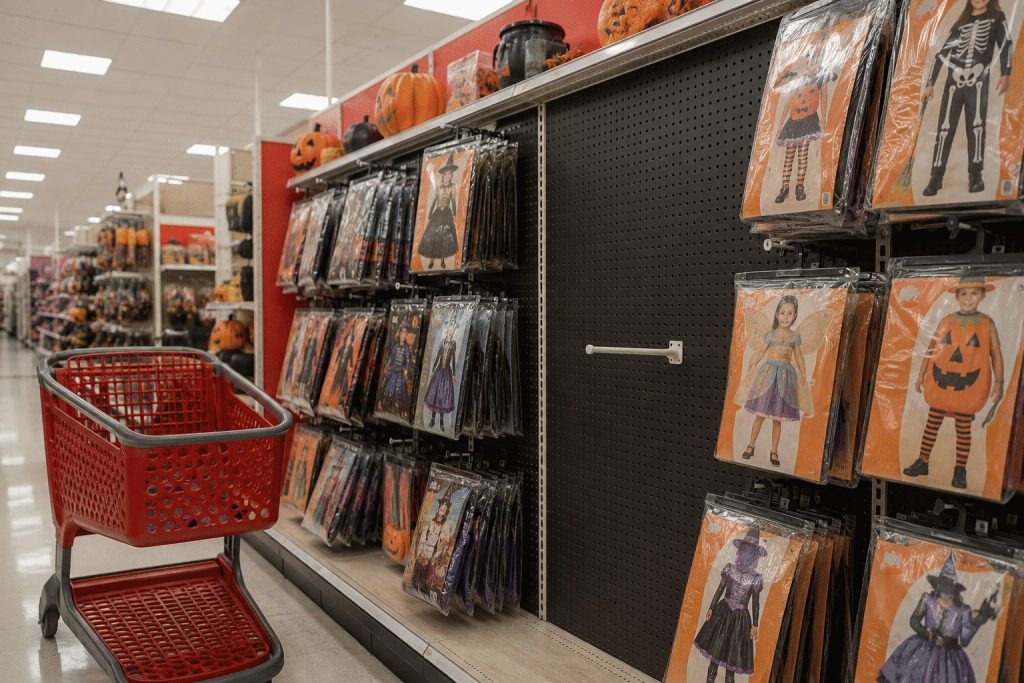
Target Corporation saw roughly $2.9 billion shaved off its market value on Tuesday after the removal of a children's costume renewed scrutiny over the…
| Q2 2026 | Reading |
|---|---|
| Net sales | $26.54B · +5.3% |
| Comparable sales | +3.8% |
| Comparable traffic | +3.6% |
| Store comparable sales | +2.7% |
| Digital comparable sales | +8.7% |
| Operating margin | 9.6%* |
| Consensus | Hold |
| Average target | $161.62 |
| Range | $121–$200 |
| Analysts | 38 |
| Average target vs. close | −1.1% |
| Product review | Specific control changes |
| Halloween quarter | Traffic and markdowns |
| Digital channel | Whether 8.7% growth holds |
| Guidance | ~5% sales growth |
| Next earnings | Expected Nov. 18 |
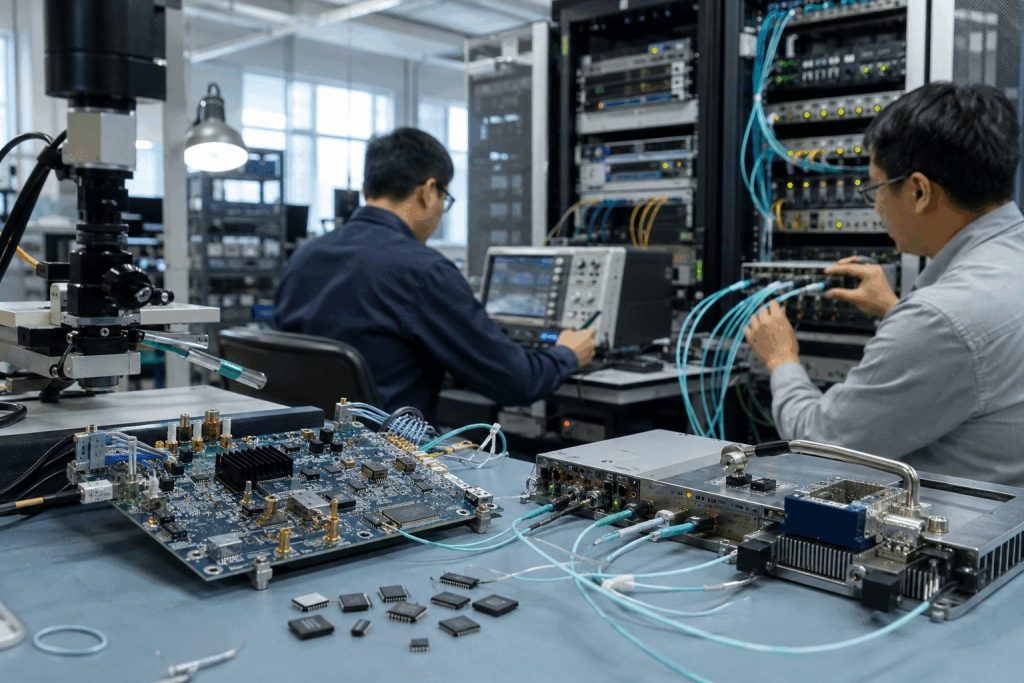
CAMARILLO, California, August 25, 2026, 17:00 EDT — Semtech stock climbed 3.3% after the chipmaker projected $410 million in sales for the current period,…
Market and company data through August 25, 2026, 17:00 EDT
Quarterly revenue, $ millions; adjusted operating margin shown on the line.
Estimated increase from Monday’s close, using 93.15 million shares.
| Regular close | $127.52 |
| After-hours | $131.70 |
| AH range | $120.65–$134.00 |
| Quoted equity value | ≈$12.27B |
| Metric | Actual | Signal |
|---|---|---|
| Revenue | $341.9M | +33% YoY |
| Adjusted EPS | $0.71 | $0.10 beat |
| Adjusted gross margin | 54.5% | +70 bps QoQ |
| Free cash flow | $61.4M | +119% QoQ |
| Regular volume | 8.58M | 2.52× average |
| Metric | Guide midpoint | Street / change |
|---|---|---|
| Revenue | $410M | 13.9% above Street |
| Adjusted EPS | $1.05 | $0.32 above Street |
| Adjusted operating income | $127M | +51.9% QoQ |
| Adjusted operating margin | 31.0% | +660 bps QoQ |
| Adjusted EBITDA | $134.3M | 32.8% margin |
| Cash | $204.1M |
| Total debt | $492.8M |
| Net debt | ≈$288.7M |
| Q2 free cash flow | $61.4M |
Company figures as of July 26, 2026, reported August 25.
| Firm / set | View | Target |
|---|---|---|
| 15-analyst consensus | Strong Buy | $201.38 avg. |
| BMO Capital | Outperform | $155 |
| Susquehanna | Positive | $200 |
| Benchmark | Buy | $230 |
Quoted equity value divided by annualized Q3 revenue guidance.
Watch: after-hours reversals, customer concentration, uneven AI orders, product-transition timing and delivery against the sharp margin ramp.
Sources: Semtech fiscal Q2 FY2027 release; Public market data; FactSet estimates reported by Investor’s Business Daily; StockAnalysis analyst compilation. Derived figures may differ from vendor calculations because of rounding.
Zoom Communications shares fell about 6.9% from their previous close after quarterly results showed faster enterprise growth but little change to the annual sales…
Enterprise momentum accelerated, but the annual revenue midpoint moved by only 0.1%. The market treated the report as an earnings-efficiency update, not a revenue reset.
Enterprise supplied 61.7% of quarterly revenue and nearly all incremental sales.
Compared with guidance issued May 21. Revenue midpoint moved from $5.085B to $5.090B.
| Metric | Q2 FY2027 | Year earlier | Change / signal |
|---|---|---|---|
| Total revenue | $1.277B | $1.217B | +4.9% |
| Enterprise revenue | $787.5M | $730.7M | +7.8% |
| Online revenue | $489.7M | $486.6M | +0.6% |
| GAAP operating income | $314.3M | $321.7M | −2.3% |
| Free cash flow | $472.4M | $508.0M | −7.0%; 37.0% margin |
| Non-GAAP operating margin | 40.0% | 41.3% | −130 bps |
| Trailing P/E | 14.8× |
| Forward P/E | 17.4× |
| Analyst consensus | Buy · 30 analysts |
| Average target | $116.80 · 19.6% above after-hours price |
| Quarterly repurchases | 3.7M shares |
| Remaining authorization | $1.3B at July 31 |
Strategic-investment gains supplied $1.614B, or 81% of GAAP pretax income. Non-GAAP net income fell 1.5% to $464.0M.
The large investment gain should not be read as recurring operating profit.
Shares of Hyperscale Data, Inc. declined 17.33% to $0.3869 on Tuesday, following a 1-for-5 reverse stock split in its debut session post-split.
The reverse split changed the share count, not the economics. The first adjusted close remained deeply below the exchange's $1 reference level.
Class B changed from roughly 23.88 million to 4.78 million shares. Options and warrants were adjusted proportionally; par value was unchanged.
Volume reached 24.31 million shares by 15:23 EDT on Aug. 25. The reference close was $0.468 on a split-adjusted basis.
Estimated Class A values use approximately 135.98 million post-split shares. The Aug. 25 decline erased about $11.0 million. The treasury held 278.0314 bitcoin worth about $21.6 million on Aug. 23.
| Metric | Latest period | Reading | Investor signal |
|---|---|---|---|
| Revenue | Q2 2026 | $34.841M | +34.8% YoY |
| Gross profit | Q2 2026 | about $8.8M | roughly 25% margin |
| Net loss attributable to common | Q2 2026 | −$21.654M | 62.2% of revenue |
| Operating cash flow | H1 2026 | −$9.885M | cash-consuming |
| Cash and equivalents | June 30, 2026 | about $36.8M | below planned campus funding need |
No reliable current sell-side consensus price target was available at publication.
Shares of Tenax Therapeutics, Inc. surged 27.84% on Tuesday following the disclosure that a significant shareholder made $1.81 million in open-market buys.
Tenax Therapeutics · NASDAQ close · August 25, 2026, 16:00 EDT
Tuesday’s 27.84% rally recovered only a fraction of the post-trial loss. The stock remains 82.4% below August 7.
| Metric | Value |
|---|---|
| Average cost | $1.7684 |
| Cost | $1.814M |
| Value at close | $2.431M |
| Paper gain | +$617K / +34.0% |
| Reported holding | 4,853,818 shares |
The filer is a 10% owner/director, not a Tenax operating executive. Filing published August 24, 2026, 18:13 EDT.
| Measure | Result |
|---|---|
| 6-minute walk distance | Primary endpoint missed |
| KCCQ symptom score | Key secondary missed |
| Lower-walk subgroup | +26.3m; nominal p=0.0112 |
| NT-proBNP | 49% greater reduction |
| RV systolic pressure | −3.5 mmHg |
| Serious adverse events | 10.8% vs 10.7% |
| Q2 2026 metric | Value | Comparison |
|---|---|---|
| Cash, June 30 | $117.98M | Runway through Q2 2028 |
| Net loss | $17.80M | $10.85M prior year |
| R&D | $12.85M | $6.12M prior year |
| Operating expense | $18.78M | $11.79M prior year |
| Shares at June 30 | 31.9M | 9.3M at Dec. 31 |
| Firm | August action | Target | Upside from $2.37 |
|---|---|---|---|
| Canaccord Genuity | Buy maintained | $4 from $35 | 68.8% |
| Guggenheim | Buy maintained | $4 from $40 | 68.8% |
| Chardan | Buy → Neutral | $5 from $27 | 111.0% |
| Evercore ISI | Outperform → In-Line | $5 from $39 | 111.0% |
Targets can lag rapidly changing biotechnology probabilities. Actions shown are dated August 11, 2026.
Market data: Public and Benzinga, regular-session close at August 25, 2026, 16:00 EDT. Insider data: Form 4 published August 24. Trial and event data: Tenax releases. Financial data: Tenax Form 10-Q for June 30, 2026. Equity value is derived from 37.42 million shares at $2.37 and may differ from vendor market-cap fields.
MOUNTAIN VIEW, California, August 25, 2026, 16:24 EDT — Shares of Intuit fell more than 7% after the company forecast a 9%-10% increase in…
| Metric | Actual | Street | Beat |
|---|---|---|---|
| Revenue | $4.354B | $4.27B | +2.0% |
| Adjusted EPS | $4.03 | $3.58 | +12.6% |
| Online Ecosystem | $2.6B | — | +17% YoY |
| Credit Karma | $743M | — | +16% YoY |
The definition change narrows the apparent EPS miss. The revenue midpoint of $4.304B still trails the $4.35B consensus by about 1.1%.
| Firm / group | Rating | Target | Upside vs close |
|---|---|---|---|
| Jefferies | Buy | $500 | 39.3% |
| Citi | Buy | $457 | 27.3% |
| 35-analyst avg. | Buy | $446.02 | 24.3% |
| TD Cowen | Hold | $328 | −8.6% |
Shares of Oklo Inc. rose 11.5% on Tuesday, as renewed U.S.-Canada trade friction renewed concerns over uranium supply, impacting advanced-nuclear stocks. Oklo finished the…
Market close · August 25, 2026 · 16:00 EDT
Ontario named uranium as possible trade leverage. Oklo rallied, though no cutoff or new Oklo contract was announced.
The session's added value equaled 6.7× Oklo's $126.9M first-half capital spending. That is a sentiment move, not realized cash flow.
| Metric | Amount |
|---|---|
| Cash + marketable securities | $3.01B |
| H1 ATM equity proceeds | $1.85B |
| H1 operating cash use | $65.5M |
| H1 capital spending | $126.9M |
| 2026 operating cash-use guide | $120–150M |
| 2026 PP&E guide | $400–500M |
Balance-sheet figures through June 30, 2026. Source: Oklo Form 10-Q and Q2 call.
| Measure | Target / view |
|---|---|
| Consensus | Buy · 15/9/1 |
| Average target | $79.88 · +80% |
| Median target | $81.50 · +84% |
| Truist | Hold · $51 |
| H.C. Wainwright | Buy · $90 |
| Canaccord | Buy · $100 |
Latest compiled targets available August 25; recent firm calls dated August 10.
Policy riskHALEU accessGroves executionAurora scheduleEquity dilution
Oklo has enough liquidity to fund near-term work, but its $8.23B value still depends on regulatory progress and future commercial deployment. The uranium threat supports the strategic case for domestic fuel. It does not itself create revenue. A reversal in trade rhetoric could therefore unwind part of Tuesday's gain.
Sources: Yahoo Finance close and volume; Oklo Q2 2026 Form 10-Q; Oklo Groves first-criticality release; Reuters and AP trade reporting; S&P Global analyst compilation. All market figures as of August 25, 2026, 16:00 EDT.
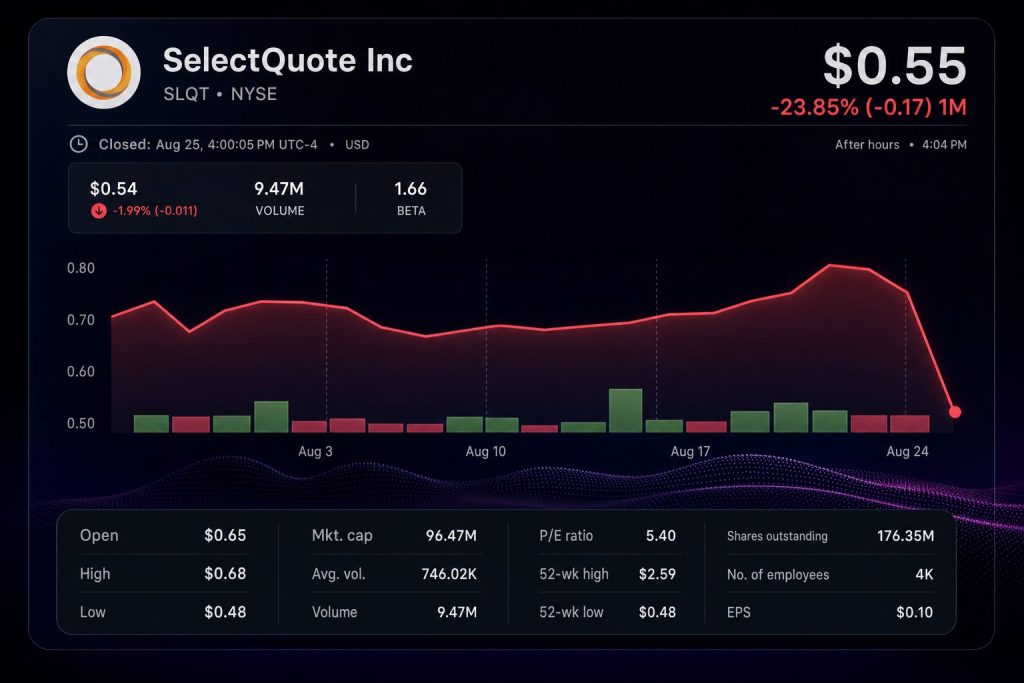
OVERLAND PARK, Kansas, August 25, 2026, 16:00 EDT — SelectQuote shares slumped 30% after the company projected lower-than-anticipated revenues for 2027, deepening its struggle…
| Revenue | $321.7M | −7% |
| Revenue vs consensus | −$31.7M | −9.0% |
| Net result | −$16.8M | from +$12.9M |
| Adjusted EBITDA | $11.9M | from $2.7M |
| Segment / metric | Q4 FY26 | YoY |
|---|---|---|
| Senior revenue | $72.5M | −12% |
| Approved MA policies | 72,180 | −15% |
| Healthcare Services revenue | $193.5M | −10% |
| SelectRx members | 109,039 | +1% |
| Prescriptions per day | 31,711 | +3.5% |
| Life adjusted EBITDA | $9.8M | +41% |
| Management target | FY2027 | Signal |
|---|---|---|
| Revenue | $1.35B–$1.45B | −9% to −16% |
| Adjusted EBITDA | $90M–$115M | midpoint −6% |
| Operating cash flow | >$60M | about 2× |
| Free cash flow | ≈$50M | new target |
| Annual tech savings | >$30M | execution needed |
| Source | Rating | Target | Date |
|---|---|---|---|
| Craig-Hallum | Buy | $3.00 | Feb 6 |
| RBC | Hold | $5.00 | Nov 20 |
| Jefferies | Hold | $2.00 | Nov 10 |
| 4-analyst consensus | Buy | $3.06 | Aug 25 |
| Cash and restricted cash | $20.7M |
| Current + long-term debt | $370.2M |
| Preferred carrying value | $298.2M |
| Preferred liquidation preference | $423.2M |
| FY2026 operating cash flow | $31.9M |
The market is valuing cash-flow execution over member growth. SelectRx prescriptions rose, but consolidated revenue contracted and the new guide sits well below consensus. The next proof points are delivery of more than $60 million in operating cash flow, realization of at least $30 million in savings, and a sustained recovery toward the NYSE's $1 minimum.
EHang Holdings Limited dropped 9.90% to $4.68 on Tuesday. The autonomous aircraft manufacturer pulled its 2026 revenue outlook following a significant quarterly sales miss.
Market snapshot: August 25, 2026, 14:48 EDT · Regular session
Q1 plus Q2 revenue totaled RMB103.6M. Reaching the former target would have required RMB496.4M in the second half, or RMB248.2M per quarter—3.19× Q2 revenue.
52-week range: $4.57–$20.20. The stock is 76.8% below the high.
Day range $4.57–$5.25
Tuesday's low matched the 52-week floor.
| Metric | Q2 2026 | Comparison |
|---|---|---|
| Revenue | RMB77.9M | +203.5% QoQ; −31.3% YoY |
| eVTOL deliveries | 36 | 4 QoQ; 52 YoY |
| Gross margin | 61.2% | 61.5% YoY |
| Operating loss | RMB131.7M | 169% of revenue |
| Cash and investments | RMB929.4M | ≈7 quarters of Q2 operating loss |
| View | Target |
|---|---|
| High | $11.10 |
| Average | $7.12 |
| BofA · Sell · Aug. 25 | $5.10 |
| Low | $4.40 |
Five ratings: 1 Buy, 2 Hold, 2 Sell.
| Stock | Snapshot | Move |
|---|---|---|
| EHang | 14:48 EDT | −9.90% |
| Archer Aviation | 13:35 EDT | −1.56% |
| Joby Aviation | 13:13 EDT | +0.97% |
The gap points to a company-specific earnings and guidance shock, not a broad eVTOL selloff.
EHang delivered 35 EH216-series aircraft and one VT35. It also sold 520 GD4.0 formation drones. Broader products diversify revenue, but passenger approvals remain the central valuation driver.
Q2 aircraft deliveries were 69.2% of the year-earlier level.
Trial operations at Guangzhou and Hefei have run for 17 months. Management now needs regulatory visibility sufficient to restore a measurable sales forecast.
Regulatory delays can push paid passenger service further out, weaken aircraft deliveries and extend cash consumption. The 61.2% gross margin does not offset an operating loss larger than revenue. Upside requires evidence that overseas sandboxes and non-passenger products can bridge the missing China approval schedule.
Sources: EHang Q2 release dated August 25, 2026; Google Finance market and analyst data captured August 25, 2026; same-session Joby and Archer snapshots captured between 13:13 and 13:35 EDT. Calculations use displayed figures and may differ because of rounding.
Shares of TNL Mediagene surged 52.7% on Tuesday after the digital media company secured a conditional extension from Nasdaq, allowing it to remain listed.…
| Metric | Amount |
|---|---|
| Nasdaq equity minimum | $2.50M |
| FY2025 reported equity | $0.918M |
| Disclosed shortfall | $1.582M |
| Metric | FY2025 |
|---|---|
| Revenue | $45.0M |
| Digital Studio revenue | $18.7M |
| Digital Studio share | 41.4% |
| Net loss | $44.6M |
| Signal | Reading |
|---|---|
| Market cap / FY2025 revenue | 0.034× |
| Enterprise value | $19.90M |
| Current ratio | 0.38 |
| 52-week price change | −93.49% |
| Item | Verified status | Investor read-through |
|---|---|---|
| Consensus rating | Not available | No traditional sell-side anchor |
| Price target | Not available | Compliance milestones dominate near-term price discovery |
| Near-term catalyst | Bid record by Sep. 21 | Observe sustained trading at or above $1 |
| Balance-sheet catalyst | Equity compliance by Oct. 30 | Capital raise could repair equity but dilute holders |
Nasdaq’s hearings panel granted conditional continued listing after an earlier delisting determination. The decision removed the immediate suspension risk. It left two hard conditions: bid-price compliance by September 21 and stockholders’ equity compliance by October 30.