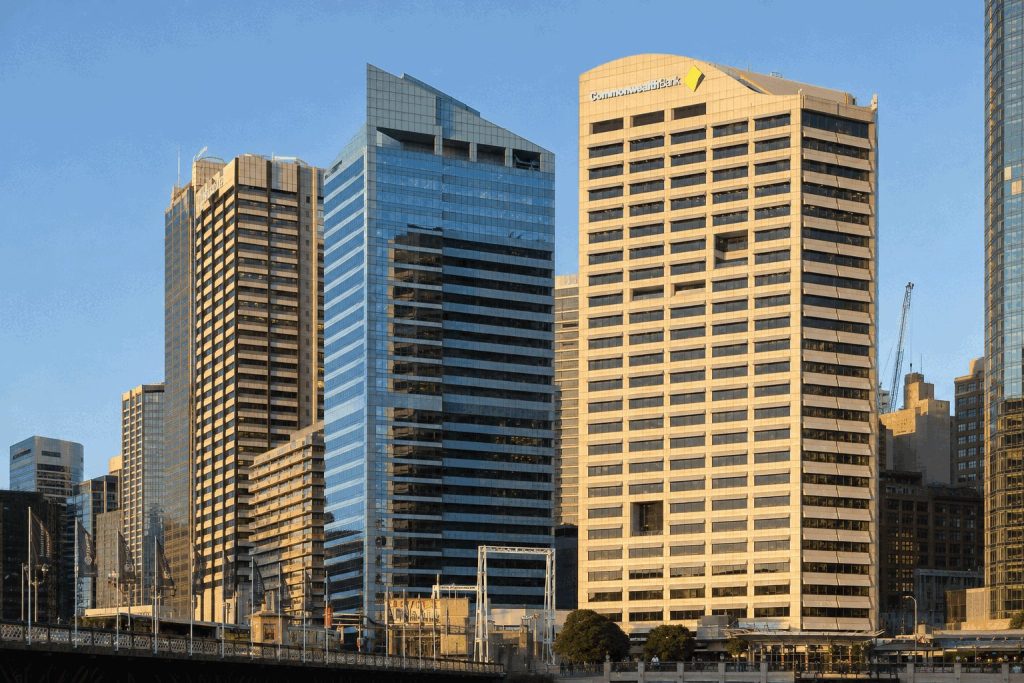
Commonwealth Bank of Australia finished down 0.7% at A$156.88 on Monday, with major Australian banks under pressure and investors assessing a card-fee overhaul that…
·4 min read
ASX:CBA • Investor dashboard
Card-fee reset meets a premium valuation
Market data: ASX close, August 24, 2026, 4:14 p.m. AEST • Currency: Australian dollars • Market closed
COMMONWEALTH BANK
Close
A$156.88
▼ 0.70% Monday
Since Aug. 11
−9.8%
From the pre-results close
FY26 cash profit
A$10.98bn
▲ 7.1% year on year
Consensus target
A$125.21
20.2% below the close
CBA close — August 3 to August 24
The decline began before Monday’s card-fee headlines. Results-day valuation pressure, weaker mortgage demand and broad bank selling remain part of the move.
Why the stock is moving
Valuation reset. The shares have lost 9.8% since the August 11 pre-results close, despite record profit.
Bank-sector weakness. All four majors fell Monday while the ASX 200 gained 0.49%.
S&P Global consensus as updated August 13, 2026: Strong Sell. Target range A$90.00–A$144.99.
Scale check: sector loss vs CBA
RBA estimated issuer lossAnnualA$660m
As % of CBA operating incomeUpper bound2.2%
As % of CBA cash profitUpper bound6.0%
Those percentages assign the entire sector-wide loss to CBA. Actual exposure is lower. The harder variable is whether repricing weakens customer loyalty.
Dated catalysts
OCT 1, 2026
New domestic interchange caps and no-surcharge rules take effect. CBA’s reworked Yello program also begins.
OCT 30, 2026
Card networks and large acquirers publish first quarterly fee data, showing early pass-through to merchants.
NEXT CBA UPDATE
Watch fee income, card balances, product switching and mortgage applications for retention evidence.
Risk frame: Yello could deepen cross-product retention and blunt the revenue loss. The downside case is customer switching at the same time that mortgage demand slows.
Shares of Applied Optoelectronics, Inc. dropped 12.1% ahead of Monday’s session after the company announced a new $600 million at-the-market equity offering. At $109.68,…
·3 min read
Investor dashboard · NASDAQ: AAOI
$600M stock plan triggers a $1.29B valuation hit
Applied Optoelectronics is funding a fast AI-optics capacity build. Monday’s selloff says investors now need cash conversion to outrun dilution.
U.S. premarket active · price data at August 24, 2026, 05:46 EDT
Premarket price
$109.68
Aug. 24, 05:46 EDT
Premarket move
-12.13%
vs. $124.82 Friday close
Value erased
$1.29B
Preliminary; 84.91M shares
New ATM
$600M
Up to 6.4% share-count expansion at $109.68
Analyst mean
$163.40
+49.0% from premarket
Price path: rally becomes financing discount
Daily closes Monday premarket
Why the stock is down
Recurring equity supplyThe new $600M ATM follows $1.03B of first-half ATM proceeds.
Capital intensityInvesting cash use reached $633.7M in six months. Operations used $73.8M.
Margin proof is pendingQ2 sales rose 86%, but GAAP margin fell 2.6 points and the net loss widened.
Demand remains strongManagement says 800G and 1.6T demand should exceed capacity through mid-2027.
Capital engine: growth is funded before it becomes cash
H1 ATM proceeds
$1.03B
H1 investing use
$633.7M
New ATM capacity
$600M
June cash + restricted
$508.8M
H1 operating use
$73.8M
Dilution arithmetic
Shares outstanding
84.91M
$600M / $109.68
5.47M shares
Potential count increase
6.4%
ATM / Friday market cap
5.7%
Value loss / ATM size
2.14×
Illustrative only. AOI is not required to sell shares, and actual prices may differ.
Q2 operating scorecard
Metric
Result
Revenue
$191.9M · +86%
Data-center sales
$107.7M · +140%
GAAP margin
27.7% · -2.6 pts
GAAP net loss
$22.8M
Premarket peer check
Stock
Move
AAOI
-12.13%
COHR
-4.39%
LITE
-4.47%
AAOI’s extra decline isolates the financing catalyst.
Analyst positioning
Call
Target
Rosenblatt · Buy
$220
Needham · Buy
$190
Raymond James · Buy
$178
Northland · Hold
$120
B. Riley · Hold
$109
What changes the view
Bull case: faster 800G/1.6T shipments, Q3 revenue above $290M and margin recovery make the factory build self-funding. Bear case: ATM sales arrive before cash conversion, while customer concentration, component constraints or weaker orders keep margins below plan.
Micron's earnings case remains strong. The new risk is expectation density: record margins, sustained AI spending and disciplined industry supply are all embedded in the bullish consensus.
Next checks
U.S. open09:30 EDT
Nvidia resultsWed., after close
Micron earningsSep. 22 est.
Market data: Nasdaq/StockAnalysis and MarketWatch, captured 24 Aug 2026 at 05:26 EDT. Financials: Micron fiscal Q3 2026. Analyst targets: S&P Global/Investing.com snapshot. Premarket data is indicative and may move sharply before the open.
Iran's economic turmoil took focus in equity markets on Monday as the rial sank to a historic low ahead of new sanctions from Washington.…
·3 min read
NYSE: XOM · Investor dashboard
Iran sanctions test Exxon's $20.6B weekly gain
Exxon Mobil Corporation · U.S. premarket active
Last regular close$165.11−0.63% Friday
August 21, 2026, 16:00 EDT
One-week move
+3.13%
$160.10 → $165.11
Market-value change
+$20.6B
Estimated using 4.11B shares
Brent Monday
−1.6%
$92.90 at 06:49 GMT
Consensus upside
+2.8%
Average target $169.68
XOM closing-price path · August 14–21
Regular-session closes, EDT. Monday premarket had no verified XOM trade when prepared.
Why the price moved
Oil's 6% weekly surge lifted producers, but Monday profit-taking threatens the premium.
U.S.-Iran talks stalled, tanker traffic stayed restricted and Washington prepared new sanctions. Exxon gained less than Brent, then crude fell before the 14:00 EDT policy announcement.
Bear: weak enforcement, diplomacy, alternative supply routes.
Valuation: average target leaves only 2.8% upside.
Sources: Reuters, AP, StockAnalysis/S&P Global and company filings. Equity data as of August 21, 2026, 16:00 EDT. Crude data as of August 24, 2026, 06:49 GMT. Dashboard prepared August 24, 2026, 05:18 EDT. Figures may differ slightly across delayed feeds.
MUMBAI, August 24, 2026, 14:28 IST — Balrampur Chini shares fell back 4.6% from earlier highs on Monday, as volatility in India’s sugar markets…
·3 min read
NSE:BALRAMCHIN · Sugar policy dashboard
The rally split in two.
India’s duty-free import quota lifted global sugar demand but threatened local mill pricing. Balrampur’s early gain became a 1.6% loss, even as smaller sugar stocks rallied.
Price snapshot: August 24, 2026, 13:50 IST · Delayed NSE data · Dashboard prepared August 24, 2026, 14:32 IST
Balrampur price
₹717.65
Day change−1.60%
Monday high₹752.00
High-to-snapshot−4.57%
Import opening
1.0m t
Normal duty100%
Quota duty0%
Import deadlineOct. 31
Valuation check
₹692.17
Six-analyst average−3.55%
Median target₹712.50
High target₹752
Seven-session price path
Closing prices through August 21. *August 24 is a delayed 13:50 IST snapshot, not a close.
Why the price turned
Local sugar price₹50+/kg
Balrampur inventory cost₹37.19/kg
Global futures responseUp to 4%
Domestic policy riskRising
A large inventory spread supports earnings. Duty-free supply threatens how long it lasts.
Quota clock
AUG. 20India announces one-million-tonne duty-free quota.
AUG. 21–28Mills and refiners apply for allocations.
BY OCT. 15Preference for importers promising earlier completion.
OCT. 31Duty-free import window closes.
Peer tape: morning snapshots
Company
Ticker
Move
Signal
Bajaj Hindusthan
NSE:BAJAJHIND
~+11%
Momentum held
Shree Renuka
NSE:RENUKA
~+7%
Import-linked buying
Triveni Engineering
NSE:TRIVENI
~+2%
Integrated model lagged
Balrampur Chini
NSE:BALRAMCHIN
−1.6%*
Early gain reversed
Peer figures were reported around 10:20 IST. Balrampur uses the later 13:50 IST snapshot.
Analyst range
ConsensusStrong Buy
Buy / Hold / Sell6 / 0 / 0
Low–high targets₹590–₹752
Spot vs average3.6% above
The rating is bullish. The target math is not. Price has outrun the average forecast.
Investor read: The quota is positive for global sugar but ambiguous for Indian mills. Balrampur’s ₹37.19 inventory cost provides a buffer. The next catalyst is allocation quality on August 28—not the one-million-tonne headline alone.
Newmont Corporation rose 0.6% to $132.35 in premarket trading on Monday as gold reached a three-month peak. The world's largest publicly traded gold miner…
·4 min read
NYSE: NEM · Gold-price sensitivity
Newmont Corporation
Bullion leverage is widening. Target upside is disappearing.
Gold: August 24, 2026, 06:44 GMT NEM premarket: August 24, 2026, 04:41 EDT
Monday's spot-based spread is 6.1% wider than the Q2 realized spread. This is an estimate using 2026 AISC guidance.
Analyst map
Scotiabank $149CIBC $170Barclays $124
Investor decision grid
Signal
Bull case
Bear case
Level to watch
Gold
Holds above planning price
Dollar rebound cuts bullion
$4,500/oz
Margin
Spot spread remains near $2,964
Costs exceed guidance
$1,680 AISC
Stock
Breaks the annual high
Target compression caps gains
$134.88
Support
Friday close holds
Premarket gain fades
$131.58
Sources: Reuters gold-market report; Newmont Q2 2026 results and guidance; S&P Global Market Intelligence via StockAnalysis. Revenue sensitivity is a transparent estimate using 5.26 million guided attributable ounces. It excludes royalties, taxes, production timing, by-product credits and price realization differences.
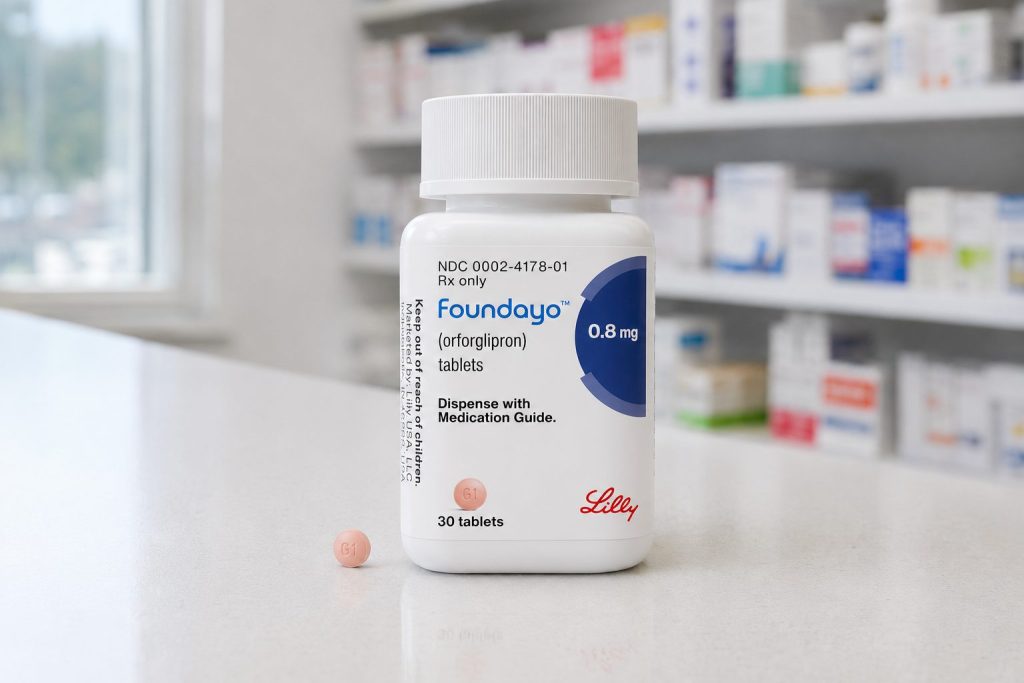
Eli Lilly and Company introduced Foundayo in pharmacies across Britain on Monday. The oral treatment for obesity debuts at about one-third the monthly private…
·3 min read
NYSE:LLY · UK Foundayo launch
Private launch. Public-pay prize.
A £100–£120 monthly tablet opens Europe for Lilly. NHS reimbursement—not pharmacy availability—sets the scale.
$1,255.26-0.01% premarket
Observed 24 Aug 2026, 04:36 EDT Prior close: $1,255.40 at 16:03:51 EDT, 21 Aug
Foundayo UK price£100–£120 Expected monthly rangeVersus Mounjaro-67% Midpoint price gapFoundayo Q2 sales$98m First reported quarterLLY valuation42.1× Trailing P/E
Q2 product scale · revenue
Illustrative UK gross run rate
£132m100k patients
£660m500k patients
£1.32bn1m patients
Annualised at £110 monthly. Scenario only; before discounts, dropouts, taxes and channel costs.
What the launch changes
Price discount
67%
Q2 Lilly share
0.4%
Analyst buys
22 / 28
Target upside
4.4%
Analyst mix · 28 ratings
22 Buy4 Hold2 Sell4.4% upside
Investor read-through
Britain validates the oral platform, but private-pay sales start small against a $86bn guidance midpoint. NICE access is the real volume gate.
What can break the case
Slow reimbursement, Novo competition, discontinuations, safety concerns or lower realised prices could expose a premium valuation.
Take-Two Interactive Software, Inc. starts Monday’s premarket session with an estimated $1.64 billion in equity value yet to recover following last week’s GTA VI-related…
Official previewExtended look scheduled for 3 p.m. EDT on Netflix.
Nov 19
Launch dateGTA VI remains scheduled for release.
Valuation loss versus booking growth
Peak-to-low
$3.14B
Peak-to-close
$1.64B
FY27 growth
$1.38B
The value still missing equals 1.19× Take-Two's projected company-wide bookings increase at the fiscal 2027 midpoint.
Analyst map
JPMorgan $310Benchmark $300UBS $300
Investor read-through
Signal
Bull case
Bear case
Level to watch
Aug. 27 preview
Verified footage resets the narrative
Presentation lacks new proof points
$248.39
Release timing
November 19 date holds
Another delay shifts bookings
Official guidance
Price support
After-hours recovery carries forward
Friday close fails
$239.62
Downside test
Aug. 20 low remains intact
Leak discount widens
$231.58
Sources: Take-Two Interactive fiscal 2026 and first-quarter fiscal 2027 results; Rockstar Games; Investing.com; StockAnalysis; The Verge's account of August 20 court filings. Equity-value estimates use 186.98 million shares. All market prices are from August 21, 2026, EDT.
Shares of Legal & General Group Plc edged down 0.3% to 283.9 pence on Monday. The insurer faces a widening broker sell wall even…
·4 min read
LON:LGEN · Investor dashboard
High yield, lower confidence
The stock is falling because broker concern over pension-transfer margins and cash remittances is overpowering strong capital returns.
Market data: 24 Aug 2026, 09:06 BST London regular session Prepared 09:32 BST
Share price
283.9p
−0.3% intraday
Since Aug. 14
−6.9%
305.0p → 283.9p
Trailing dividend yield
7.7%
21.79p / 283.9p
Buyback / market cap
7.7%
£1.2bn / £15.68bn
Seven-session price path
The steepest move came on Aug. 20. Friday volume reached 56.3m shares.
Broker target map
Jefferies185p
Citi245p
Goldman257p
JPM / RBC270p
UBS280p
Spot283.9p
Peel Hunt320p
Berenberg385p
Eight-target average: 276.5p, or 2.6% below spot.
What is moving the stock?
Pressure
Citi cut 2026–27 remittance forecasts 4.5%. UBS highlighted UK pension-transfer margins of 4.2%, down from 7.1%. Six tracked brokers now rate the shares sell, underweight or underperform.
Support
Core operating profit rose 7%. EPS gained 11%. The solvency ratio is 201%. A £1.2bn buyback and 7.7% trailing yield limit the bear case.
Operating scorecard
Metric
Latest
Change / reference
Core operating profit
£918m
+7%
Core operating EPS
12.15p
+11%
Asset-management fee earnings
—
+37%
Solvency II coverage
201%
Above 160%–190% range
UK PRT margin
4.2%
7.1% year ago
Capital-return math
£1.2bn buyback progress
37.5%
£450m completed by end-July. Completed value equals roughly 2.9% of current market capitalisation.
Decision levels
280p UBS target / near support 245p Citi downside case 320p Peel Hunt upside case
Shares of Take-Two Interactive Software, Inc. enter Monday's premarket as the company's most significant release faces heightened attention. Subpoenas followed leaked Grand Theft Auto…
·3 min read
NASDAQ: TTWO · Investor dashboard
GTA VI leak risk meets a $760m expectations gap
Take-Two Interactive Software, Inc. · Market status: U.S. premarket
Last regular close$239.62−0.22% Friday
August 21, 2026, 16:00 EDT
1-week move
−3.0%
$246.95 → $239.62
Market value
$44.8B
About $1.37B lost in a week
Below 52-week high
−9.9%
High: $265.94 on July 7
Consensus target
$286.89
+19.7% implied upside
Price path · August 14–21
Regular-session closes, EDT. The stock recovered from Wednesday's $237.04 close but finished the week lower.
Why the stock moved
Leaks weakened launch control; legal action limited the damage.
Unauthorized GTA VI footage surfaced before the August 27 preview. Take-Two subpoenaed Microsoft and Discord. Shares briefly lost about $2.8B of value, then recovered as the November 19 release stayed on track.
Current price is 90.1% of the 52-week high.
Bookings bridge
FY2027
Value
Guidance low
$8.00B
Guidance midpoint
$8.10B
LSEG estimate
$8.86B
Gap
$760M
The Street expects 9.4% more than management's midpoint.
Bear: more leaks, weaker preview, delays, cancellations.
Key swing: the $760M bookings gap.
Data: Take-Two, Reuters/LSEG, StockAnalysis, Investing.com and The Verge. Price and market value as of August 21, 2026, 16:00 EDT. Dashboard prepared August 24, 2026, 04:22 EDT. Figures may differ slightly across delayed feeds.
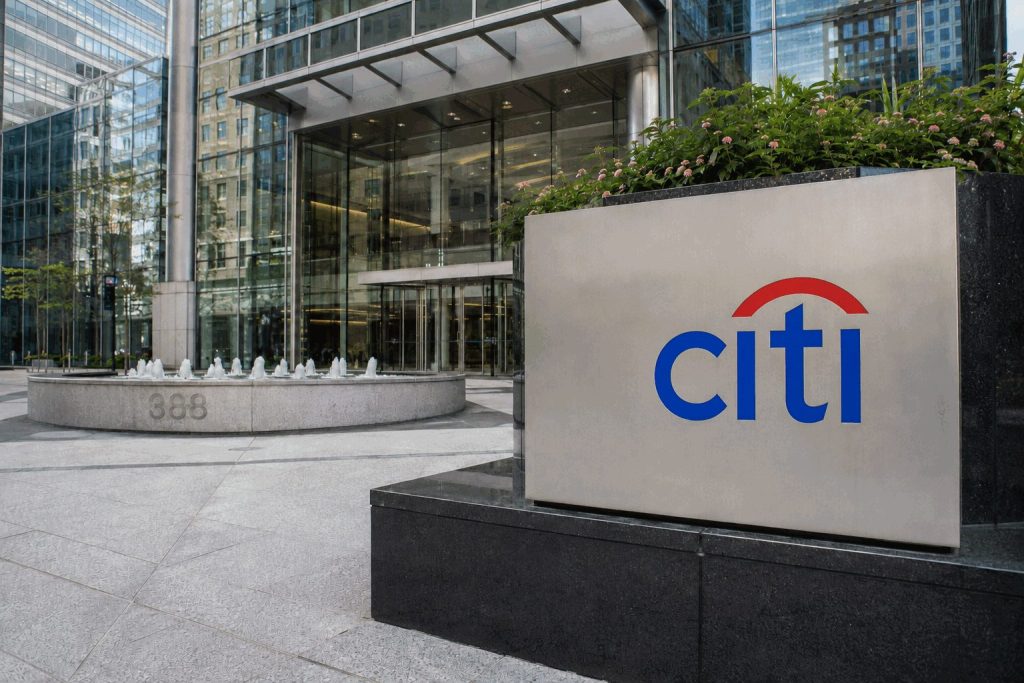
Citigroup Inc. starts the week facing a rare dilemma over its capital allocation. The bank's $30 billion repurchase approval is now comparable to the…
·4 min read
Citigroup Inc. · NYSE:C
Buyback or bank deal?
The $30bn capital choice now dominates the takeover debate.
Market data: Aug. 21, 2026, 16:00 EDT Prepared: Aug. 24, 2026, 09:13 CEST
Last close
$131.65
+1.53% Friday
Five-day move
-5.51%
$139.33 → $131.65
Market value
$220.6bn
About 7.4× the buyback
Analyst target
$154.50
17.4% implied upside
Citi’s six-session price path
Why the stock moved: Four straight declines cut the shares by 6.9% before Friday’s rebound. The new M&A chatter adds a capital-allocation question to Citi’s existing restructuring story.
Screened targets vs Citi’s $30bn buyback
FITB
60%
HBAN
84%
CFG
102%
RF
116%
KEY
129%
Bar labels show buyback as a share of each regional’s market value. Values exclude takeover premiums, credit marks and integration costs. No target has confirmed talks.
Capital and earnings snapshot
Metric
Reading
Signal
CET1
12.8%
120bp above 11.6% requirement
Tangible book/share
$100.89
1.30× at Friday close
Q2 revenue
$24.8bn
+14% year on year
Q2 net income
$5.8bn
+45% year on year
Analyst ratings
16 Buy / 5 Hold
0 Sell
What investors should watch
Management languageOrganic growth remains Citi’s stated focus. Any change would be material.
Formal filingsDeal talk is speculation until a board action or regulatory application appears.
Capital trade-offA large target would compete directly with buybacks and transformation spending.
Sources: Citigroup Q2 2026 earnings release and stress-test disclosure; SEC filing; Reuters; CNBC; Investing.com; StockAnalysis. Target market values are approximately $49.72bn FITB, $35.68bn HBAN, $29.43bn CFG, $25.86bn RF and $23.34bn KEY at Aug. 21. This dashboard is informational, not investment advice.
Boeing's largest 737 MAX 10 customer now expects 88% of its firm order after 2027. That delivery split makes certification timing a cash-flow issue,…
·3 min read
NYSE: BA · Investor dashboard
Boeing MAX 10: delivery value moves right
Market data: August 21, 2026, 4:00 p.m. EDT Prepared August 24, 2026, 8:12 a.m. CEST
Friday close
$214.20
BA, NYSE close
One-week move
−7.54%
Aug. 14–21
Market value
$169.3bn
At Friday close
Street target
$274.85
+28.3%, preliminary
Six-session repricing
Why the stock fell
Labor clock
17,000 engineers and technicians rejected contract offers.
Certification tail
Safety assessments were only 32% complete on July 28.
Cash-flow support
Q2 free cash flow returned to $631 million.
United's 167 MAX 10 commitments
Delivery windowContractExpected
H2 202630
20274420
After 2027120147
88.0% now sits after 2027, up from 71.9% contractually.
Certification closeout
Planned flight tests · 100%
Development assurance review 4 · 60%
System safety assessments · 32%
Boeing targets certification in 2026. FAA approval remains the gate.
Q2 recovery
Revenue$24.56bn+8%
Commercial deliveries171+14%
Free cash flow$631m+$831m YoY
Total backlog$715bnRecord
Analyst balance
Strong Buy1864.3%
Buy517.9%
Hold517.9%
Sell00.0%
28-analyst S&P Global-based compilation, updated August 12.
Sources: United Airlines Form 10-Q filed with the SEC; Boeing 737-10 certification update and Q2 2026 results; Reuters; StockAnalysis/S&P Global. The estimated $13.8 billion weekly market-value decline and target upside are preliminary. Informational only; not investment advice.
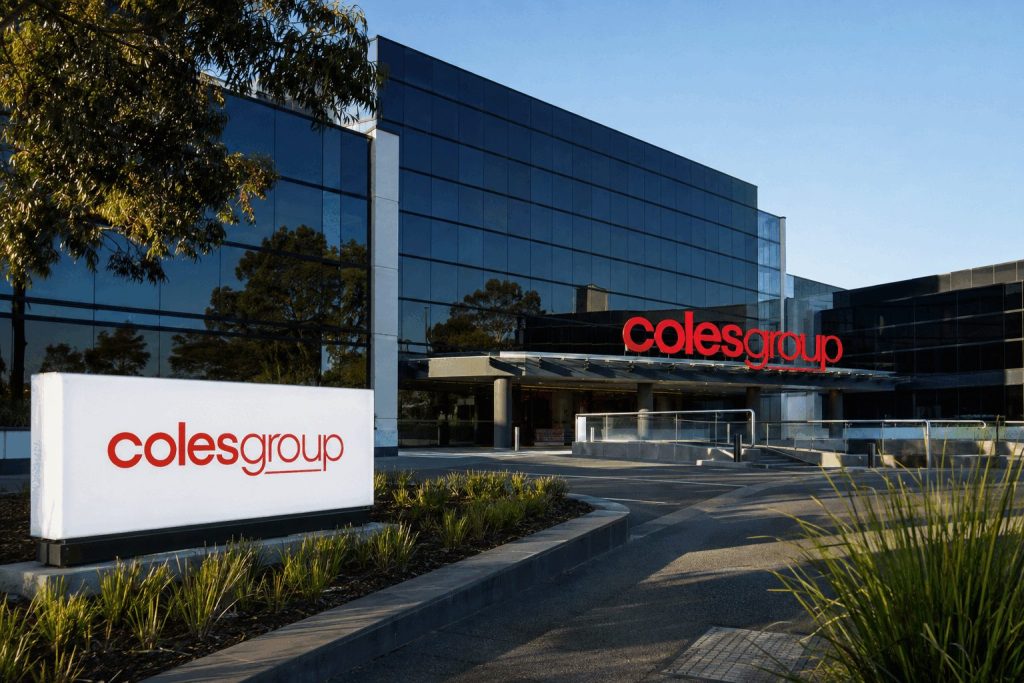
Coles Group Limited shares traded mostly flat on Monday following a disruption caused by an alcohol pricing mistake that took both its website and…
·4 min read
ASX:COL · ONLINE CONTROL TEST
Flat stock, larger digital stakes
Price: August 24, 2026, 2:06 p.m. AEST, during ASX trading. Financial and incident data compiled at 2:57 p.m. AEST.
COL intraday
A$22.79
-0.1% · market open
Q3 online sales
A$1.384bn
Two non-overlapping channels
Online / group sales
12.9%
A$1.384bn ÷ A$10.703bn
Average target
A$23.74
+4.2% implied upside
Six-session price path
*August 24 is the 2:06 p.m. AEST intraday reading; prior points are closes.
Incident facts
Products identified66+
Jack Daniel's cartonA$130 → A$27
Largest cited savingA$173
Website/appRestored
Order count and refund cost remain undisclosed.
Growth divergence
Supermarket online
+24.8%
Group sales
+3.1%
Liquor online
+1.8%
Liquor total
-3.9%
Online supermarket growth = 8× group growth
Analyst split
Buy
8
Hold
6
Sell
1
Target rangeA$16.50–A$27.00
Why the stock is barely moving: the glitch is verified, but Coles has not quantified a material cost. Tuesday's FY26 report is the larger catalyst. Watch online revenue, liquor margin, fourth-quarter sales and FY27 cost guidance.








![UK Stock Market Today 24/08/2026 [UPDATE: 16:53 BST] [Miners Preserve FTSE’s Edge as Cboe Closing Cross Runs]](https://ts2.tech/wp-content/uploads/2026/08/UK-market-dashboard-2026-08-24-1653-1024x683.jpg "UK Stock Market Today 24/08/2026 [UPDATE: 16:53 BST] [Miners Preserve FTSE’s Edge as Cboe Closing Cross Runs]")