TTWO price
$228.50
−2.12% · −$4.95
Take-Two Interactive Software stock declined 2.12% while Rockstar Games initiated its last marketing campaign for Grand Theft Auto VI.
| Metric | Latest | Signal |
|---|---|---|
| Q1 FY2027 bookings | $1.39B | −3% year on year; slightly above guidance |
| Recurrent consumer spending | 84% of bookings | −1% year on year |
| FY2026 bookings | $6.72B | Baseline before GTA VI launch year |
| GTA V installed base | >230M units | Proof of franchise durability |
| GTA VI pre-orders | “Unprecedented” | Management description; not yet recognized sales |
Search attention and the showcase are strong. The stock still fell 2.12%, suggesting investors want execution evidence, not another anticipation cycle.
At $228.50, the market discounts roughly 30% upside to the analyst target. That spread also embeds delay, launch-quality and mobile-performance risk.
The common stock added roughly $5.2 billion of quoted value. The bitcoin reserve gained about $1.9 billion at the same snapshot.
Before debt, preferred equity, tax and other claims.
| Measure | Reading | Why it matters |
|---|---|---|
| BTC acquisition cost | $63.36B / $75,385 each | Current token price sits 6.6% higher |
| USD Reserve | $5.10B | Supports dividends and interest |
| USD Cash | $1.59B | Flexible treasury deployment |
| Q2 long-term debt | $6.7B | Down 18% in the quarter |
| Q2 preferred equity | $14.4B | Senior claim to common stock |
| Q2 software revenue | $122.4M | Up 6.9% year over year |
| Action, Aug. 17–23 | Amount | Investor interpretation |
|---|---|---|
| MSTR shares sold | 18.26M | Common-stock dilution |
| Net proceeds | $2.0065B | About $109.88 per share |
| STRC repurchase | $136.4M | Reduces preferred claim |
| USD Reserve increase | $300M | Extends obligation coverage |
| Bitcoin traded | None | 840,447 BTC unchanged |
MSTR’s daily gain materially exceeded bitcoin’s. That leverage can reverse. Common issuance, preferred dividends, debt service, tax changes, regulation and contraction of the equity multiple can outweigh a stable token price.
Primary data: Strategy Aug. 24 Form 8-K and Q2 2026 results. Market data timestamped above.
Salesforce market data at 10:28 EDT; operating metrics released Aug. 26.
| Company | Price | Move |
|---|---|---|
| ServiceNow (NOW) | $137.16 | +9.03% |
| Salesforce (CRM) | $248.29 | +20.75% |
| Workday (WDAY) | $197.39 | +3.48% |
| Oracle (ORCL) | $150.84 | +1.32% |
NOW at 10:37 EDT; peer prices at about 10:28 EDT on Aug. 27, 2026.
2:40 p.m. EDT today
ServiceNow CFO Gina Mastantuono speaks at Deutsche Bank's technology conference.
Next quarter
Watch whether cRPO holds near 20% constant-currency growth and AI ACV converts into subscriptions.
Risk
The rally is a peer read-through. Average target upside is now only 3.7%.
The U.S. search phrase “now stock” also points to ServiceNow's expanded Tech Mahindra partnership. It was announced Aug. 20, not today. Tech Mahindra says its ServiceNow deployment handles more than 100,000 monthly cases across 90 countries, supports 150,000 employees and has optimized about 25% of first-level support work.
Intraday snapshot: August 27, 2026, 10:15:13 EDT
The stock recovered from its session low but remained 5.0% below Wednesday’s close.
The market erased about $2.97 billion while Moderna proposed $2.0 billion of base financing.
| Term | Current disclosure |
|---|---|
| Security | Senior unsecured convertible notes |
| Maturity | 2032 |
| Regular interest | None |
| Purchaser option | $300M for 13 days |
| Settlement | Cash, shares or both |
| Capped-call threshold | At least 150% premium at pricing |
| Metric | Amount | Read-through |
|---|---|---|
| Cash + investments | $6.9B | June 30 |
| Q2 operating cash outflow | $526M | Base notes = 3.8× |
| Q2 net loss | $782M | Base notes = 2.6× |
| July settlement payment | $950M | Post-quarter cash use |
| 2026 year-end cash guide | $4.7B–$5.2B | Before new deal update |
23 analysts · average target $104.53
Target dispersion is wide after the oncology-data rally. The financing terms now add a separate dilution and balance-sheet variable.
The financing converts part of the recent oncology revaluation into liquidity. No regular coupon limits cash interest, but conversion can expand the share count. The capped call only protects up to its final cap.
Pricing: conversion rate, premium and net proceeds.
Hedging: capped-call cost and counterparties’ trading.
Use of funds: oncology investment versus debt repayment.
Risk trigger: weaker clinical or regulatory progress after leverage rises.
Sources: Moderna August 27 financing announcement; Moderna July 31 quarterly results; Google Finance; MarketScreener. Calculations use the $142.20 share price and $56.54 billion market capitalization observed at 10:15:13 EDT on August 27, 2026. Values are rounded.
The AI-memory read-through remains strong. Price action says investors still want Micron-specific proof on HBM volume, pricing and margins.
August 27 value is intraday at 09:39 EDT; earlier values are official closes. The stock opened at $967.01 before fading.
| Metric | Current / latest | Comparison | Investor reading |
|---|---|---|---|
| Fiscal Q3 revenue | $41.46B | $23.86B prior quarter | +73.8% sequential |
| Operating cash flow | $25.39B | $11.90B prior quarter | Cash conversion strengthened |
| Adjusted free cash flow | $18.3B | $7.1B capex | Funds expansion internally |
| Adjusted gross margin | 84.9% | 74.9% prior quarter | Exceptional, hard to sustain |
| Forward P/E | 6.5× | 21.2× trailing | Large earnings-cycle assumption |
| Net cash | $23.75B | $21.03 per share | Balance-sheet cushion |
HBM is stacked memory placed beside AI accelerators. Higher accelerator shipments increase the addressable memory content, but Micron’s realized revenue still depends on qualification, allocation, pricing and yield.
| Reference | Target / value | Upside from $943.46 | Implied FY2027 P/E |
|---|---|---|---|
| Current price | $943.46 | — | 6.1× |
| BMO / Mizuho | $1,300 | 37.8% | 8.4× |
| Analyst average | $1,515 | 60.6% | 9.8× |
| Analyst low | $361 | −61.7% | 2.3× |
| Analyst high | $2,200 | +133.2% | 14.2× |
| Measure | Period | Value |
|---|---|---|
| Close before catalyst | Aug. 26 | $0.34 |
| Premarket range | Aug. 27, 07:30 EDT | $0.66–$0.68 |
| Q2 revenue | Quarter ended June 30 | ~$0.4M |
| H1 revenue | Six months ended June 30 | $1.4M · +112% |
| Q2 operating loss | Quarter ended June 30 | $4.2M · −34% |
| Q2 operating cash use | Quarter ended June 30 | $5.2M · −18% |
| Cash | June 30 | $2.79M |
The market added almost one quarter's cash consumption. That is meaningful for a microcap, but small beside the funding needed to commercialize diagnostics.
Status at Aug. 27: validation completed; commercial discussions disclosed, but no contract value or revenue timetable announced. The $2.8B annual sepsis opportunity is a company estimate, not guidance.
| Metric | Current | Comparison |
|---|---|---|
| GAAP gross margin | 75.0% | 74.0% Q3 midpoint |
| GAAP operating income | $63.73bn | +124% Y/Y |
| Operating cash flow | $24.08bn | Q2 FY2027 |
| Accounts receivable | $63.06bn | +64% since Jan. 25 |
| Inventory | $31.58bn | +48% since Jan. 25 |
| Capital returned | $26.0bn | Q2 buybacks + dividends |
| Forward P/E | 17.9× |
| AMD forward P/E | 37.2× |
| Intel forward P/E | 46.2× |
| Analyst consensus | Buy · 61 analysts |
| Average target | $305.79 |
| Raymond James | Strong Buy · $352 |
NASDAQ:QBTS • company stock move
The SEC filing says the resignation was not caused by a disagreement over operations, accounting, disclosures or controls.
| Q2 revenue | $3.1M |
| Q2 GAAP operating expenses | $55.0M |
| Q2 adjusted EBITDA loss | $37.1M |
| First-half bookings | $35.5M |
| Remaining obligations | $40.7M |
| Cash + securities | $546.2M |
The $543M unrecovered value equals 15.3× first-half bookings and roughly 175× quarterly revenue.
| Company | Close | Move | Market cap |
|---|---|---|---|
| D-Wave | $17.51 | −9.51% | $6.52B |
| IonQ | $40.03 | −4.83% | $14.72B |
| Rigetti | $15.94 | −5.87% | $5.31B |
| Quantum Computing | $8.35 | −1.24% | $1.88B |
The average target is 101% above the $17.51 close. Targets are estimates, not guarantees.
Large system contracts make revenue recognition uneven. First-half bookings included one $20 million sale. A slower conversion of the $40.7 million obligation balance, continued operating-cost growth, or another finance-management change would increase valuation pressure. Continuity on September 2 is the next confirmed governance checkpoint.
| Metric | Result | Year over year |
|---|---|---|
| Revenue | $570.6M | +1.7% |
| U.S. same-restaurant sales | — | −7.0% |
| U.S. systemwide sales | $2.88B | −8.2% |
| U.S. restaurant margin | 13.8% | −240 bps |
| Operating profit | $79.3M | −24.0% |
| Net income | $32.6M | −40.8% |
| H1 free cash flow | $120.3M | +9.9% |
FactSet current estimates on Aug. 26. One month earlier: $0.14, $0.57 and $0.64, respectively.
| Company | P/E | Consensus |
|---|---|---|
| Wendy’s | 13.7x | Hold |
| Restaurant Brands | 21.4x | Buy |
| Yum! Brands | 19.5x | Buy |
| Reference | Price | Distance |
|---|---|---|
| 52-week high · June 16 | $225.64 | −38.1% |
| Average analyst target | $220.20 | +57.7% |
| Aug. 26 close | $139.63 | Base |
| IPO price · June | $135.00 | +3.4% |
| 52-week low · Aug. 3 | $104.83 | +33.2% |
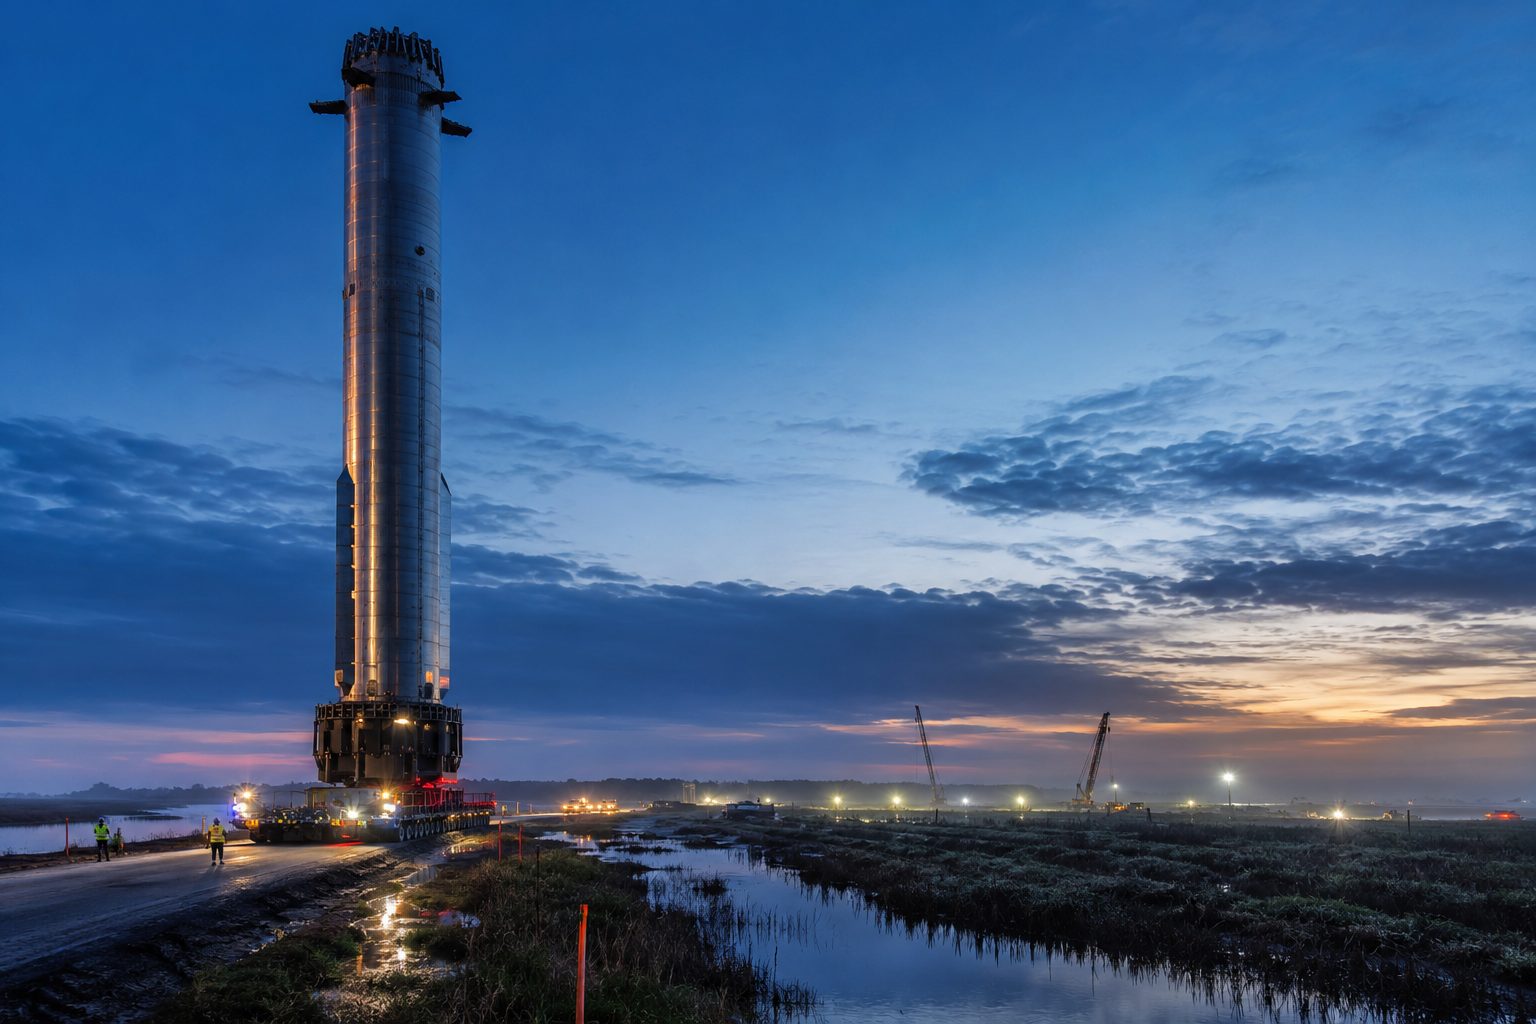
Louisiana expands Starship launch capacity for three revenue engines: external launch services, Starlink deployment and orbital AI infrastructure. The $100 billion headline equals all June liquidity and 3.5 times first-half capex.
Starship cadenceStarlink capacityAI satellitesNo annual spending schedule, financing plan or return target was disclosed. Starship reusability, permits, wetland mitigation and launch demand must advance before the campus can earn a return.
engineeringregulationcash burnenvironment| Checkpoint | Timing | What investors need |
|---|---|---|
| Phased budget | Not disclosed | Annual cash use, debt and partner funding |
| Permits and wetlands plan | Pre-construction | Schedule certainty and mitigation cost |
| Construction start | Expected 2027 | Evidence the plan is funded and active |
| Starship scale-up | Ongoing | Reliability, reusability and lower launch cost |
| First Louisiana launch | Targeted 2029 | Capacity begins supporting revenue channels |
Market snapshot: August 26, 2026, 19:49 EDT (August 27, 01:49 CEST). Regular-session figures unless noted.
+121.7% versus Wednesday's close
| Metric | Value | Growth |
|---|---|---|
| Total revenue | $67.4bn | +17% |
| Total cloud | $34.0bn | +39% |
| Cloud infrastructure | $18.1bn | +77% |
| Cloud applications | $15.9bn | +11% |
| RPO | $638bn | +363% |
RPO equals about 9.5 times annual revenue, but converts over several years.
| Operating cash flow | $32.0bn |
| Capital expenditure | −$55.7bn |
| Free cash flow | −$23.7bn |
| FY26 debt raised | $43bn |
| FY26 equity raised | $5bn |
| Planned FY27 financing | ≈$40bn |
Planned FY27 financing includes a previously announced $20bn at-the-market equity program.
| Company | Close | Daily move | Market value | P/E |
|---|---|---|---|---|
| Oracle | $148.87 | +2.84% | $433.5bn | 26.7× |
| Microsoft | $496.37 | +0.91% | $3.70tn | 29.5× |
| Alphabet | $342.00 | −1.40% | $4.18tn | 17.2× |
| SAP ADR | $211.68 | −2.45% | $247.1bn | — |
August 26 U.S. close; latest trade timestamps ranged from 19:15 to 19:38 EDT.
Average target across 39 analysts tracked by MarketBeat.
| Low | $145 |
| Average | $263.97 |
| High | $400 |
| Average implied upside | 77.3% |
Citi opened a positive 90-day catalyst watch. Oracle also held a financial analyst meeting at 10:45 CT.
Investors will test cloud-capacity delivery, financing costs and signs that the historic selloff is losing force.
| Risk | Investor transmission | Watch point |
|---|---|---|
| Build delays | Defers contracted revenue | Capacity delivery |
| Negative cash flow | Raises external-funding needs | Capex and OCF |
| Equity issuance | Dilutes existing holders | $20bn ATM program |
| Credit pressure | Increases financing costs | Spreads and ratings |
| Customer concentration | Raises contract and renewal sensitivity | RPO mix |
Sources: Oracle investor relations, Citi commentary reported August 26, Yahoo Finance, MarketBeat and consolidated U.S. market data. Market-value changes and peak-value gaps are estimates using the current implied share count; rounding may create small differences.
Market snapshot: August 26, 2026, 19:34 EDT (August 27, 01:34 CEST). Prices after the U.S. regular close.
The regular decline erased an estimated $940m. Late trading recovered about $454m, leaving roughly $486m below Tuesday's value.
Implied after-hours market value divided by management's above-$4bn year-end AI Cloud ARR target.
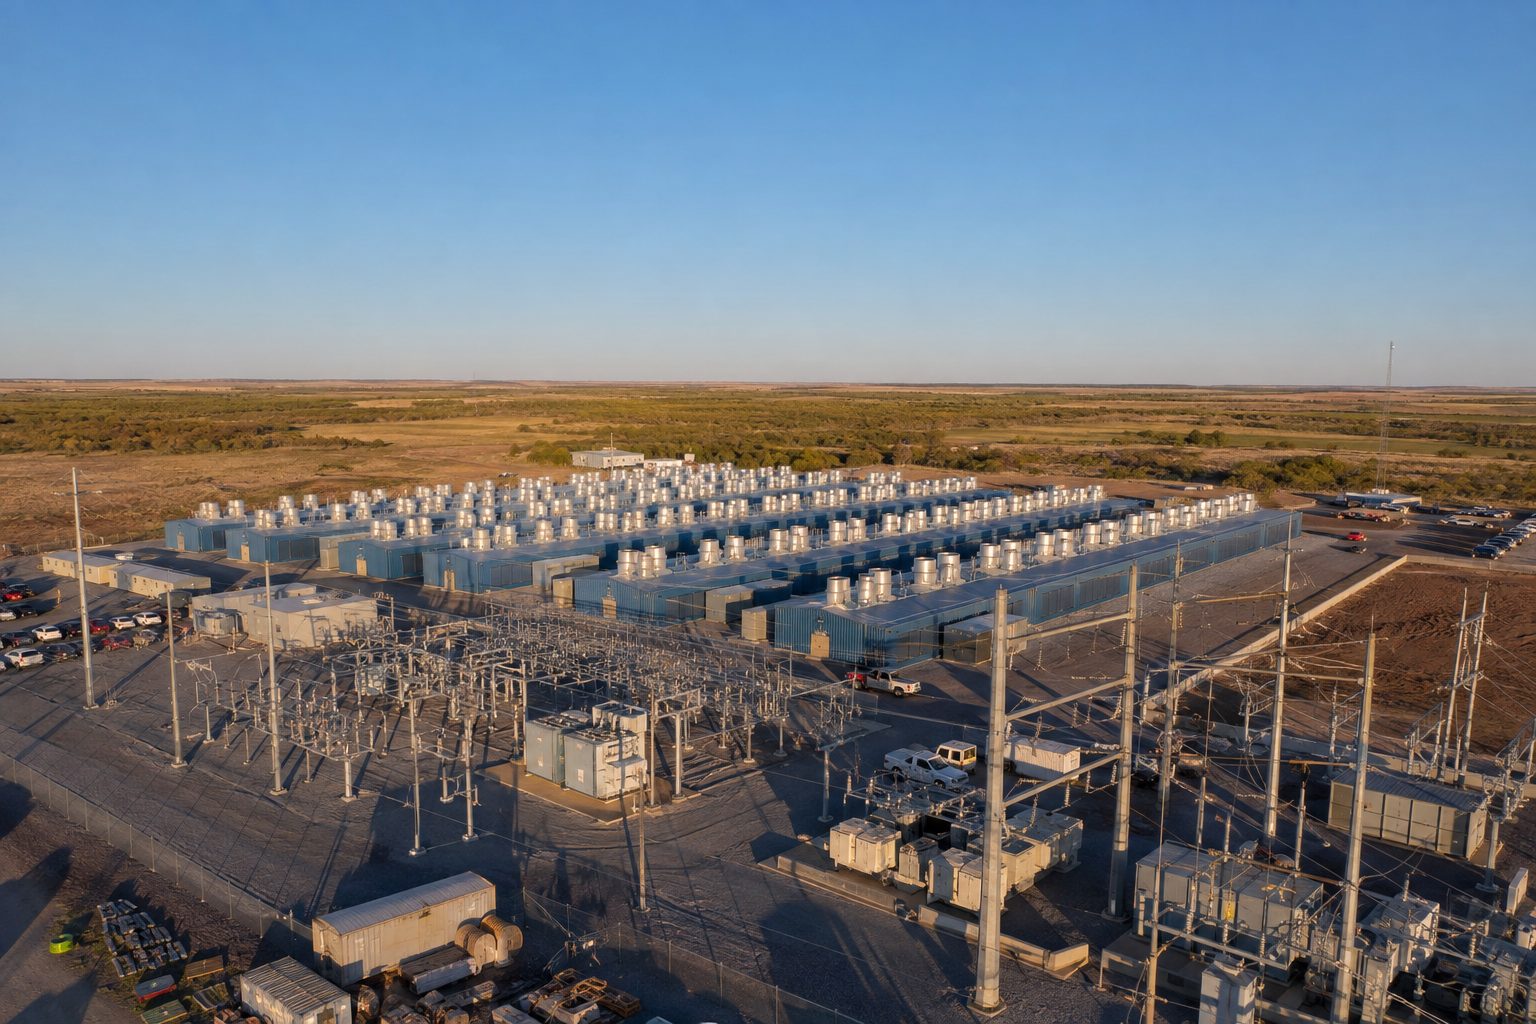
About 85% of the target ARR is under contract. Weighted average term: roughly four years.
Customer prepayments cover about 45% of associated GPU capital spending.
| Provider | Revenue | EPS |
|---|---|---|
| MarketBeat | $132.00m | −$0.55 |
| Zacks preview | $138.89m | −$0.80 |
These are separate provider forecasts, not a blended consensus. Results: August 27. Call: 5:00 p.m. EDT.
| Metric | Q3 FY26 | Q2 FY26 | Seq. |
|---|---|---|---|
| Revenue | $144.8m | $184.7m | −21.6% |
| Adjusted EBITDA | $59.5m | $75.3m | −21.0% |
| Net income/(loss) | −$247.8m | −$155.4m | Wider loss |
Quarter ended March 31, 2026. Lower Bitcoin prices and mining-hardware retirements weighed on results.
| Company | Close | Move | Value | Volume |
|---|---|---|---|---|
| IREN | $39.58 | −6.23% | $14.15bn | 37.45m |
| CoreWeave | $88.01 | −0.03% | $48.54bn | 12.13m |
| Nebius | $213.93 | −3.62% | $58.16bn | 9.17m |
August 26 U.S. regular close. Source: Yahoo Finance.
Average target across 21 analysts tracked by MarketBeat.
| Low | $46 |
| Average | $83 |
| High | $105 |
Pre-results snapshot. Targets can change rapidly after earnings.
| Risk | Transmission to investors | Watch point |
|---|---|---|
| Delivery delay | Pushes contracted ARR recognition outward | Energization and GPU-install dates |
| Capital intensity | Raises financing or dilution risk | Capex, prepayments and unrestricted cash |
| Customer concentration | Increases renewal and counterparty sensitivity | New contract mix |
| Mining volatility | Obscures the AI Cloud transition | Bitcoin economics and retired capacity |
Sources: IREN filings and releases, Yahoo Finance, MarketBeat and Zacks. Market-value changes are estimates derived from Yahoo's August 26 closing price and market capitalization. Figures may differ because of rounding and after-hours liquidity.
Regular close: August 26 at 16:00:01 EDT. After-hours quote: 18:03:50 EDT. Total gain from the prior close: 5.65%.
From the after-hours price, the options upper bound offered 6.2% upside. The lower bound represented 13.1% downside. The skew shows how Wednesday’s late rally consumed much of the bullish move.
Recent options signal published August 24, 2026; range recalculated from the August 26 closing price.
| Metric | Expectation / guide | Change |
|---|---|---|
| Revenue consensus | $2.71B | ≈+35% YoY |
| Adjusted EPS consensus | $0.93 | +38.8% YoY |
| Company revenue guide | $2.70B ±5% | +11.7% QoQ midpoint |
| Adjusted EPS guide | $0.93 ±$0.05 | $0.88–$0.98 |
| Non-GAAP gross margin | 58.25%–59.25% | 58.9% in Q1 |
| Diluted share count | 915M expected | Company guide |
Fiscal Q1 revenue was a record $2.418 billion. Non-GAAP net income reached $718 million, while operating cash flow hit a record $638.8 million.
| Measure | Value | Read-through |
|---|---|---|
| Trailing P/E | 84.2× | Premium leaves little room for a weak guide |
| Closing market cap / Q2 revenue | 81.3× | One quarter, not an annual multiple |
| Annualized Q2 price/sales | ≈20.3× | Assumes the quarter repeats |
| Yahoo one-year target | $266.36 | +4.9% from after-hours price |
| Susquehanna target | $265 | Positive; +4.3% from after hours |
| Rosenblatt target | $300 | Buy; +18.1% from after hours |
Price, P/E and consensus-target snapshot: August 26, 2026, 18:03:50 EDT. Fresh brokerage targets were reported August 25.
Google can buy the warrant shares at $206.58. Most vest only when product-purchase thresholds are met through fiscal 2033. Dilution is therefore tied to sales conversion.
| Company | Session move | Trailing P/E |
|---|---|---|
| Marvell | +1.97% | 84.2× |
| Nvidia | −1.52% | 31.9× |
| Broadcom | −0.33% | 97.6× |
| AMD | +0.36% | 123.6× |
Marvell sits between Nvidia and higher-multiple custom-compute peers. Its earnings must validate optical-networking growth and the custom-silicon pipeline.
Peer close data retrieved August 26, 2026, 17:52 EDT.
Expectations: An in-line quarter may not support the multiple.
Margin: Memory and optical-component costs can compress profitability.
Execution: Custom silicon ramps require long design and qualification cycles.
Dilution: Google warrants equal 6.4% of guided diluted shares.
Tape: Regular volume was only 39% of the three-month average.
Fiscal Q2 2027 results and conference call — August 27, 2026, 16:45 EDT. The market will compare any guidance raise with a $228 billion implied after-hours valuation and the 10% options move.
Sources: Yahoo Finance · Marvell Q1 results · Marvell event notice · Investopedia · Reuters
| Metric | Prior | New | Midpoint change |
|---|---|---|---|
| FY2026 revenue | $9.63B–$9.71B | $9.69B–$9.74B | +$45M · +0.47% |
| FY2026 adjusted EPS | $14.72–$14.80 | $15.04–$15.10 | +$0.31 · +2.1% |
| Q4 revenue | — | $2.53B–$2.58B | New range |
| Q4 adjusted EPS | — | $4.10–$4.16 | New range |
| FY2026 free cash flow | — | ~$2.60B | 26.8% of revenue midpoint |
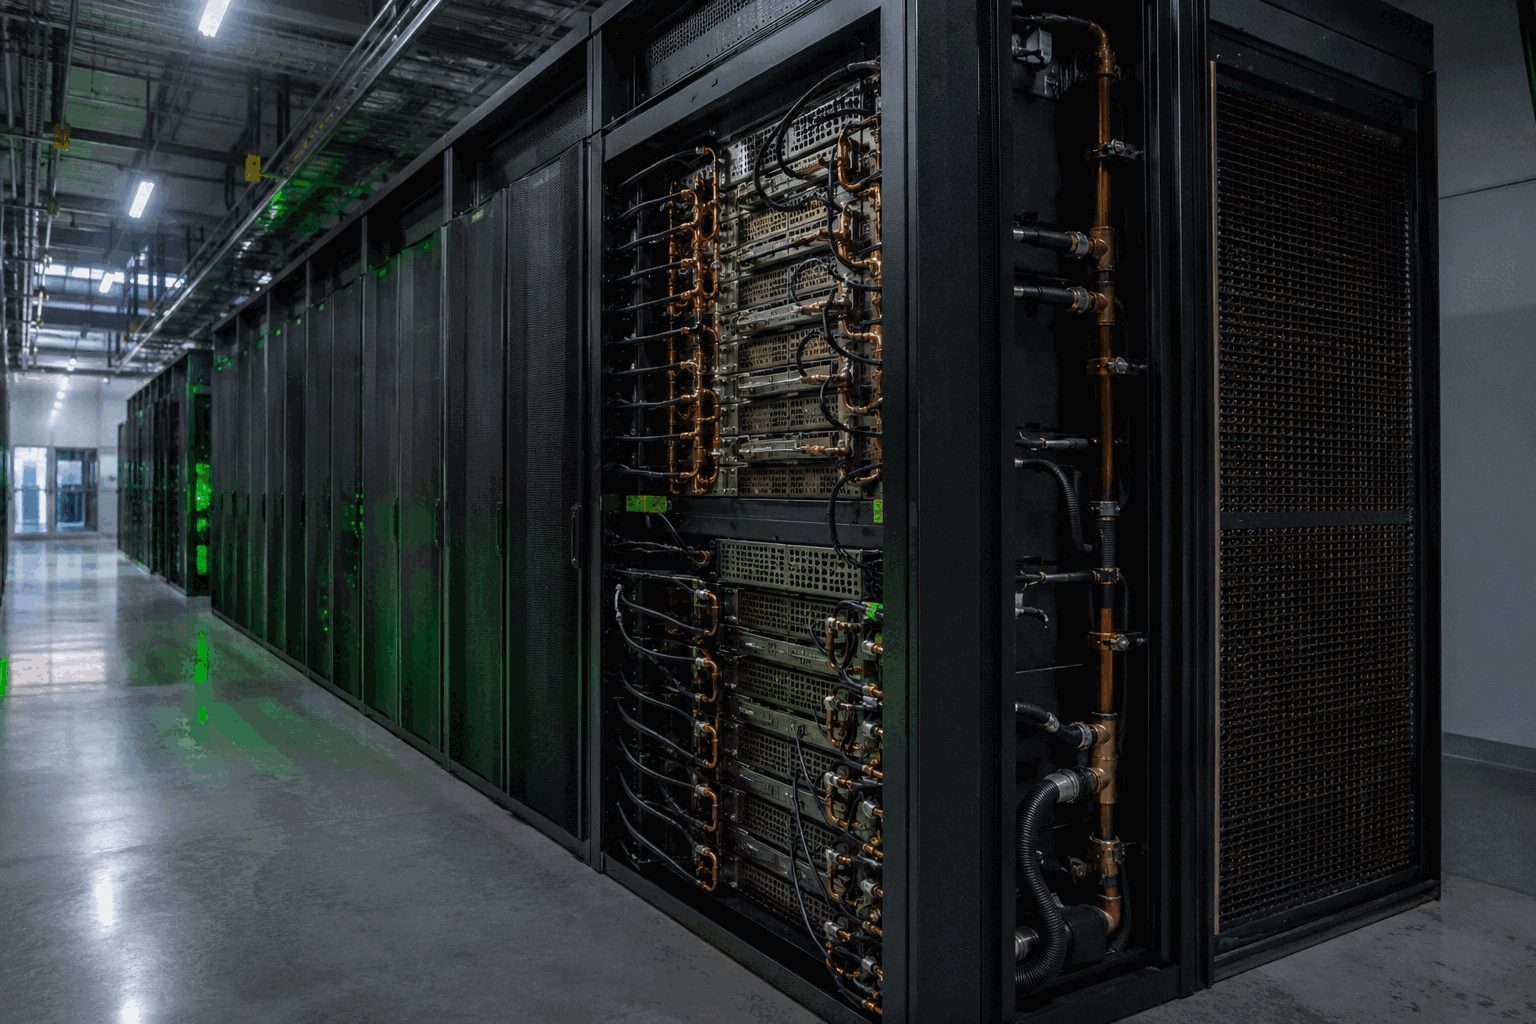
| Measure | Value | Signal |
|---|---|---|
| Adjusted EPS | $2.22 | +6.2% vs est. |
| Q2 gross margin | 75.0% | Flat QoQ |
| Q3 gross margin | 74.0% | -1.0 pt |
| Free cash flow | $21.34B | -56% QoQ |
| DSO | 60 days | +15 days |
| Metric | Q2 FY27 | Sequential | Why it matters |
|---|---|---|---|
| Data Center | $89.0B | +18% | Core demand remains strong |
| ACIE | $40.3B | +25% | Faster than hyperscale |
| Receivables | $63.1B | DSO 45→60 | Cash conversion slowed |
| Inventory | $31.6B | +22% | Rubin launch build |
| Operating cash flow | $24.1B | -52% | Working capital and taxes |
Bull: $108B revenue converts to cashBull: ACIE sustains 25% QoQ growthBear: margin falls below 73.5%Bear: DSO extends againBear: customer guarantees activate
Commitments are future obligations, not immediate debt. Guarantees are contingent. The valuation test is whether Nvidia's revenue and free cash flow scale faster than supply, lease and customer-support exposure.
Information gain: the day’s $4.13 decline erased roughly $530 million of quoted equity value. The unlocked block itself was worth about $1.68 billion at $16.25.
GENB rose 26.4% from Aug. 21 through Aug. 25, then gave back nearly the entire advance. It remained 1.6% above the $16 IPO price at 15:06 EDT on Aug. 26.
| Metric | Latest | Investor read |
|---|---|---|
| Cash + securities | $457.4M | 21.9% of market cap |
| H1 operating cash use | $138.3M | Runway into H1 2028 |
| Q2 collaboration revenue | $6.3M | −37.7% year over year |
| Q2 net loss | $67.3M | Widened from $56.7M |
| Q2 GB-0895 external R&D | $20.5M | +54.3% year over year |
What changes next: ownership supply drove this session. September data can shift the focus back to GB-0895’s pharmacology and the twice-yearly dosing case.
As of Aug. 26, 2026. Morgan Stanley reiterated Buy with a $22 target on Aug. 17; Piper Sandler reiterated Buy with a $24 target on Aug. 7.
Bull case: little actual lock-up selling would make the 20% drop look like a temporary supply discount. Positive COPD data could strengthen the six-month dosing proposition ahead of larger severe-asthma readouts.
Risk case: sustained insider or venture-holder sales could cap rebounds. Weak September pharmacology, faster cash use, or Phase 3 delays would raise financing and dilution risk before commercialization.
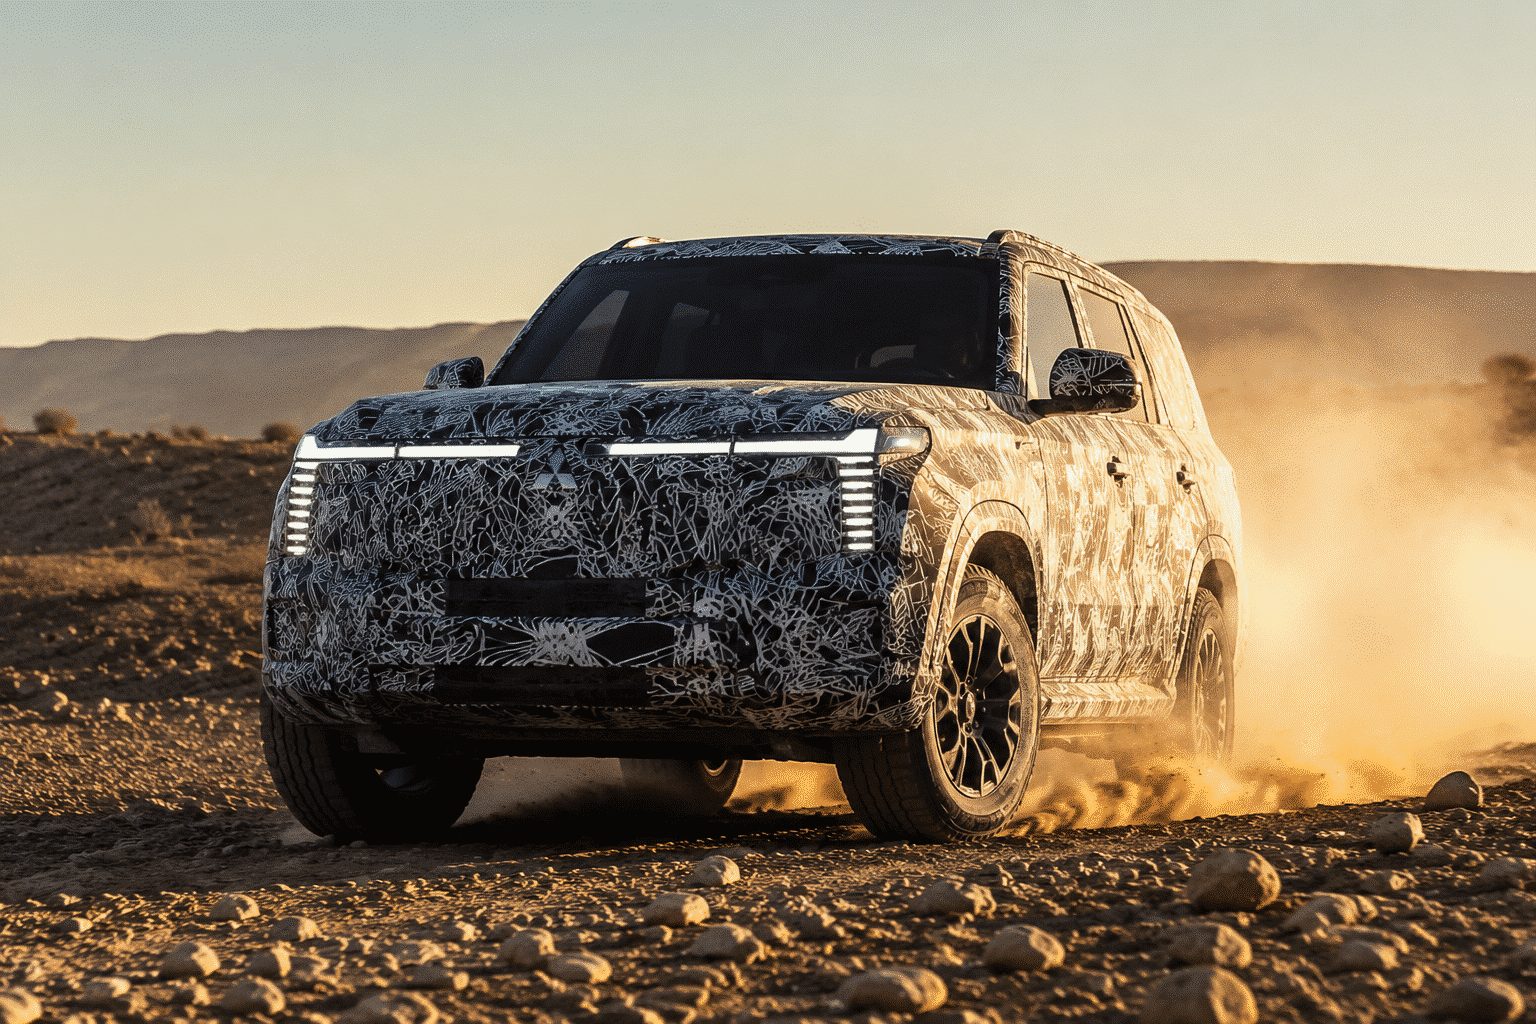
Flagship SUV return meets a low-margin growth plan.
Market data: August 26, 2026, 15:30 JST · Dashboard: August 27, 2026, 03:42 JST
Equity-value change uses the ¥9.20 share gain and 1.34 billion shares outstanding.
| Signal | Verified measure |
|---|---|
| Global return | After 5 years |
| Lifetime sales | >3.25M units |
| Historical markets | >170 |
| Dakar record | 12 wins |
| Platform | Triton ladder frame |
| Drive control | S-AWC |
Lifetime Pajero sales equal 3.8 times Mitsubishi's current full-year volume target.
Reveal date and triple multi meter confirmed.
Pricing, powertrain and initial markets are key.
Management links Pajero to sales growth.
857,000 retail units and 2.8% margin.
Sources: Mitsubishi Motors official Pajero site and releases; Mitsubishi Motors Q1 presentation summary; StockAnalysis and Investing.com market and consensus data. Currency is Japanese yen. Estimates are explicitly marked.
| Metric | Q2 2026 | YoY |
|---|---|---|
| Total sales | $5.442B | +7.5% |
| Cardiovascular | $3.624B | +8.3% |
| MedSurg | $1.818B | +5.9% |
| Adjusted EPS | $0.86 | +14.7% |
| GAAP net income | $907M | +13.8% |
| Signal | Current reading |
|---|---|
| FY26 sales growth | 5.5%–6.5% reported |
| FY26 adjusted EPS | $3.28–$3.32 |
| Q3 adjusted EPS | $0.80–$0.82 |
| P/E | 19.38× |
| Analyst consensus | Buy · 31 analysts |
| Average target | $62.69 · 31% upside |
| Recovery path | Revenue effect | Investor implication |
|---|---|---|
| Faster than Stryker | Below $316M | More orders may shift within the quarter rather than disappear. |
| About three weeks | $316M–$369M | Evercore's 600–700 bp scenario; a guide cut becomes plausible. |
| Longer or broader | Above $369M | Margin pressure and customer disruption could outlast shipment delays. |
Boston Scientific has not determined whether the incident is reasonably likely to be material. The full scope, recovery duration and any data loss remain unknown.
Sources: Boston Scientific Q2 2026 results; Reuters, Aug. 26, 2026; Google Finance quote at 09:40:21 EDT; StockAnalysis analyst consensus. The $316M–$369M range is a scenario calculation, not company guidance.
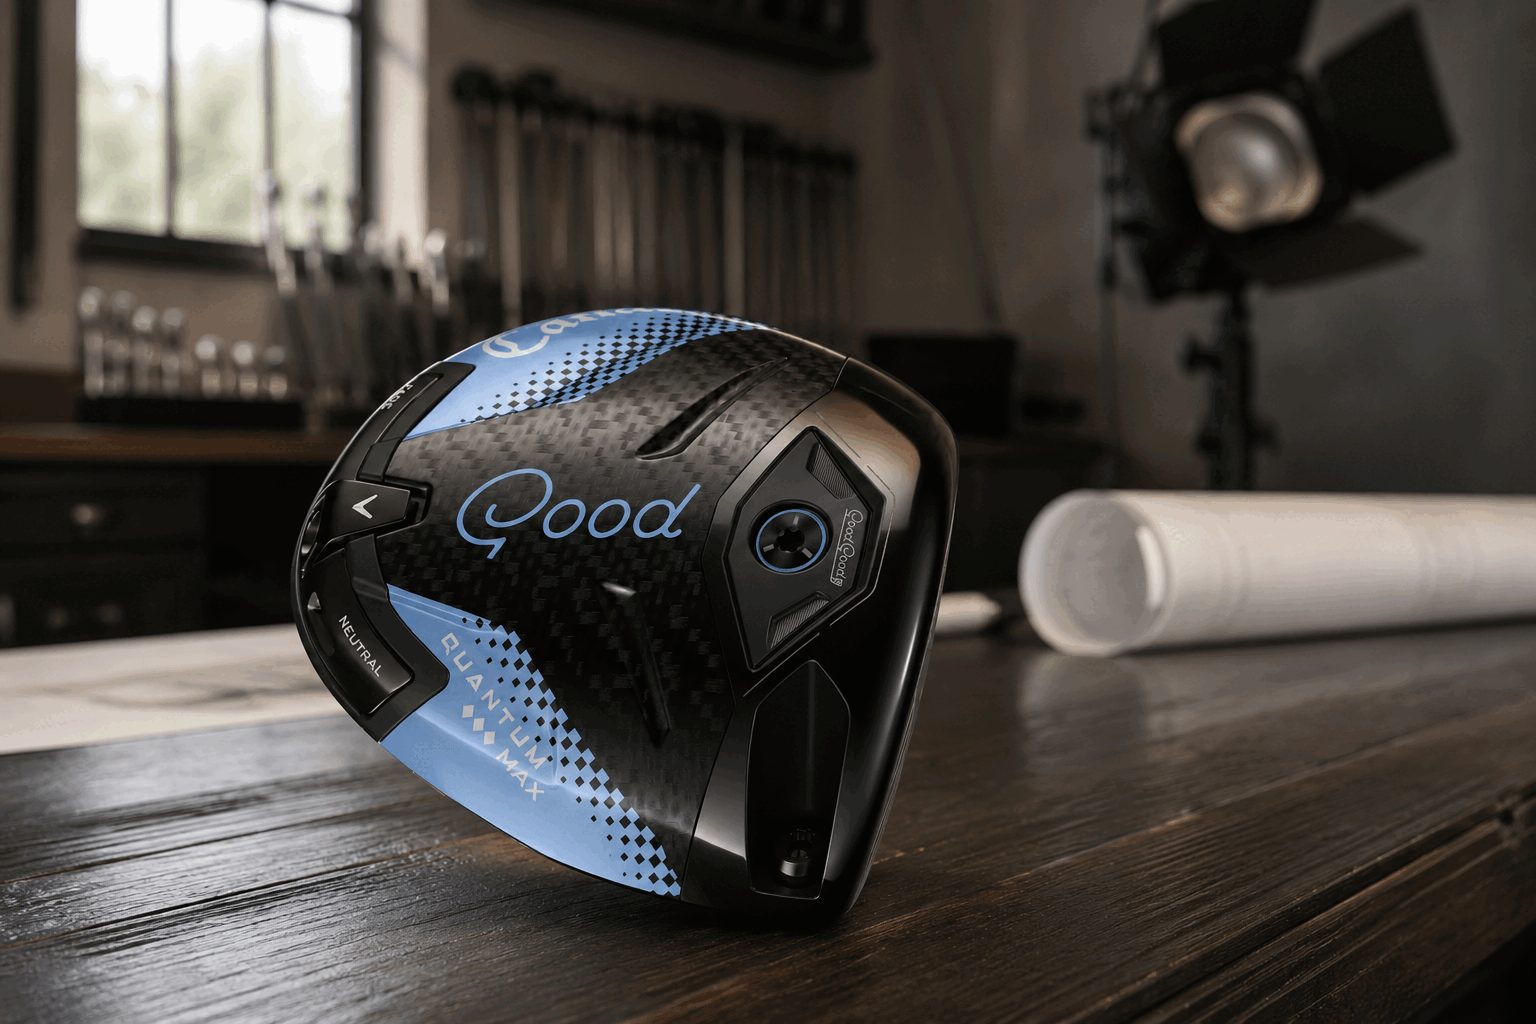
Good Good Quantum Triple Diamond Max, 460cc head, adjustable 10g weight.
| Metric | Result |
|---|---|
| Revenue | $430.3M · +4.5% |
| Operating income | $100.3M · +31.6% |
| Operating margin | 23.3% · +480 bp |
| Share of group sales | 70.3% |
| Metric | Result |
|---|---|
| Q2 sales | $612.2M · +2.0% |
| GAAP gross margin | 50.1% · +620 bp |
| FY26 sales guide | $2.045B–$2.070B |
| FY26 adjusted EBITDA | $246M–$260M |
| Average target | $20.50 |
| Implied upside from $15.47 | 32.5% |
| Coverage | 11 analysts |
| Rating mix | 5 Strong Buy · 5 Hold · 1 Sell |
Contained case: investigations close without retailer, media or partner withdrawals; the 0.58% premarket rebound persists. Adverse case: partner action raises campaign costs or weakens demand in a segment producing 70.3% of quarterly sales. Watch the product listing, PGA Tour decisions and management's next equipment-sales commentary.

| Units | Standard | Ultimate |
|---|---|---|
| 10M | $0.80B | $1.00B |
| 25M | $2.00B | $2.50B |
| 50M | $4.00B | $5.00B |
| Buy / Hold / Sell | 27 / 0 / 1 |
| Average target | $286.89 |
| Implied upside | 23.2% |
| Low / High | $170 / $368 |

![Asia Stock Market Today 28/08/2026 [UPDATE: 00:51 SGT] [Salesforce Leads KASE Global Into Final Minutes After Asia’s Split Close]](https://ts2.tech/wp-content/uploads/2026/08/Asia-market-dashboard-2026-08-28-0051-480x384.jpg "Asia Stock Market Today 28/08/2026 [UPDATE: 00:51 SGT] [Salesforce Leads KASE Global Into Final Minutes After Asia’s Split Close]")