NASDAQ:WENStock Market
Wendy’s shares drop 12.9% as Trian exit wipes out takeover premium
Wendy's stock dropped 12.9% after its top shareholder withdrew from a potential acquisition. The decline wiped out nearly the entire bid-fueled surge seen in…

Market intelligence
All coverage
Wendy's stock dropped 12.9% after its top shareholder withdrew from a potential acquisition. The decline wiped out nearly the entire bid-fueled surge seen in…
| Previous close | $9.04 |
| Open | $7.88 |
| Intraday high | $7.98 |
| Intraday low | $7.68 |
| Volume | 11.35m |
| Average volume | 8.96m |
| Relative volume | 1.27× |
| Trailing P/E | 11.9× |
| Annualized dividend yield | 3.6% |
| Q2 2026 | Current | YoY |
|---|---|---|
| Global systemwide sales | $3.423bn | −6.5% |
| U.S. systemwide sales | $2.876bn | −8.2% |
| Adjusted EBITDA | $124.1m | −15.4% |
| Net income | $32.6m | −40.8% |
| Adjusted EPS | $0.18 | −37.9% |
| Measure | Before | Now |
|---|---|---|
| Quarterly dividend | $0.14 | $0.07 |
| Annualized payout | $0.56 | $0.28 |
| 2026 outlook | Issued | Withdrawn |
| Q2 repurchases | — | $0 |
The bid premium is gone. Wendy's valuation now depends on five operational levers: menu quality, value, marketing, execution and digital frequency. Revenue growth is less useful while franchise royalties, traffic and restaurant margins fall.
● Trian could revisit a bid, creating sharp volatility.
● Traffic losses directly reduce franchise royalties.
● Higher turnaround spending can delay margin recovery.
● International growth may not offset U.S. weakness.
BOISE, Idaho, August 27, 2026, 09:39 EDT — Micron Technology's stock has erased 82% of its Nvidia-driven opening gap, with attention staying on its…
The AI-memory read-through remains strong. Price action says investors still want Micron-specific proof on HBM volume, pricing and margins.
August 27 value is intraday at 09:39 EDT; earlier values are official closes. The stock opened at $967.01 before fading.
| Metric | Current / latest | Comparison | Investor reading |
|---|---|---|---|
| Fiscal Q3 revenue | $41.46B | $23.86B prior quarter | +73.8% sequential |
| Operating cash flow | $25.39B | $11.90B prior quarter | Cash conversion strengthened |
| Adjusted free cash flow | $18.3B | $7.1B capex | Funds expansion internally |
| Adjusted gross margin | 84.9% | 74.9% prior quarter | Exceptional, hard to sustain |
| Forward P/E | 6.5× | 21.2× trailing | Large earnings-cycle assumption |
| Net cash | $23.75B | $21.03 per share | Balance-sheet cushion |
HBM is stacked memory placed beside AI accelerators. Higher accelerator shipments increase the addressable memory content, but Micron’s realized revenue still depends on qualification, allocation, pricing and yield.
| Reference | Target / value | Upside from $943.46 | Implied FY2027 P/E |
|---|---|---|---|
| Current price | $943.46 | — | 6.1× |
| BMO / Mizuho | $1,300 | 37.8% | 8.4× |
| Analyst average | $1,515 | 60.6% | 9.8× |
| Analyst low | $361 | −61.7% | 2.3× |
| Analyst high | $2,200 | +133.2% | 14.2× |
London, August 27, 2026, 12:35 Oil prices climbed as tanker traffic through the Strait of Hormuz continues to hold at 77% below the level…
Transit count compares with a recent daily average of 15. Flow figures are million barrels per day.
| Signal | Latest reading | Investor channel | What changes the price |
|---|---|---|---|
| Iran–Oman framework | Details still being finalized | Geopolitical premium | Credible enforcement and sustained traffic |
| Qatar mediation | Tehran visit on Aug. 27 | Near-term volatility | Broader ceasefire or talks failure |
| U.S. crude stocks | 428.9m barrels; +95,000 | WTI balance | Build was 84% smaller than expected |
| Refinery utilization | 97.4% | Crude demand | Seasonal maintenance or margin compression |
| SPR releases | Sales ending soon | Inventory cushion | Lower state supply without Gulf recovery |
| Case | Reference | Brent implication | Direct exposures |
|---|---|---|---|
| Fast reopening | Traffic normalizes quickly | Pressure toward $78 Q4 EIA average | Negative oil beta; positive transport margins |
| Gradual reopening | EIA base path | Near $85 Q3 average | Balanced producer and consumer effects |
| Talks stall | Risk premium returns | Retest of $93.78 Aug. 20 level | Positive USO/XLE; inflation risk rises |
Scenarios frame transmission, not price targets. EIA forecasts Brent at $78 in 4Q26 and $69 in 2027.
Crude exposure: USO tracks near-term WTI futures and can diverge through roll costs.
Energy equities: XLE adds company execution, dividends and refining exposure.
Rates and inflation: Higher oil can lift inflation compensation and pressure duration assets.
Transport: Airlines, trucking and chemicals benefit when the premium falls.
Key risk: Futures are pricing better logistics before ship counts confirm them.
Apple Inc. stock climbed 1.15% on Wednesday, with the company announcing September 9 as the date for its upcoming Apple Event. The increase of…
Event time confirmed by Apple. Product expectations are reported, not company-confirmed.
Quarterly margins calculated from Apple’s filing. Stock statistics checked Aug. 26, 2026.
| Question | Evidence now | What changes the thesis |
|---|---|---|
| Can the event expand premium mix? | iPhone revenue rose 21.7% year on year. | Higher opening price with credible shipment scale. |
| Can hardware protect margins? | Products carried a 40.1% gross margin; tariff refunds lifted total margin. | Supply, yield and component-cost disclosures. |
| Is a foldable material? | IDC estimate cited by Reuters: over 17M units by 2027. | Apple confirmation, price and availability. |
| Does valuation allow disappointment? | 33.8× forward earnings; average target offers 4.1% upside. | Stronger upgrade evidence or higher estimates. |
Execution: A rumored foldable could be delayed, expensive or supply-constrained. Demand: Premium pricing may meet weaker global smartphone demand. Margin: High component costs could absorb the benefit of a richer mix. Expectation: The shares already gained $51.8 billion before Apple disclosed any product details.
Sources: Apple event page and fiscal Q3 filing; Reuters reporting dated Aug. 26, 2026; S&P Global estimates via StockAnalysis. Dollar figures are U.S. dollars. Calculations may differ from rounded reported values.
ASUS launched U.S. preorders for the ROG Xbox Ally X20 at $1,299. Shares of ASUSTeK Computer Inc., the parent company, gained 4.97% to NT$971…
| Signal | Latest | Change / context | Investor read-through |
|---|---|---|---|
| Q2 brand revenue | NT$241.1B | +39% YoY | Premium products support growth |
| Q2 operating profit | NT$19.6B | +230% YoY | Strong operating leverage |
| Gross margin | 16.5% | +4.1 pts YoY | Mix is financially material |
| High-value mix | >65% | Q2 revenue share | X20 fits stated strategy |
| X20 display | 7.4-inch OLED | 1080p · 120Hz | Supports 30% price premium |
| Processor | Ryzen AI Z2 Extreme | 8 cores · 50 TOPS NPU | Matches prior Ally X silicon class |
ASUS disclosed no preorder count, production target or product margin. A limited edition can lift average selling price without moving total revenue. Component inflation, premium-handheld competition and weak conversion after October 15 are the key measurable risks.
Rezolve AI PLC climbed 21.81% on Tuesday following the adoption of its distributed database technology by Google. The stock ended the session at $2.96,…
Market data: August 25, 2026, 4:00 p.m. EDT
After-hours: 7:59 p.m. EDT • Dashboard: August 26, 2026, 01:10 EDT
+21.81% • +$0.53
−1.68% from close
7.7× 12.9M 3-month average
≈$211M added Tuesday
The close remains 65.0% below the 52-week high despite Tuesday’s surge.
Rezolve says its database provides indexing and pipelines behind Google Cloud Web3 datasets.
Preliminary H1 covers 35.3% of guidance. H2 must run about 83% above H1.
| Measure | Numerator | Denominator | Multiple |
|---|---|---|---|
| Market cap / FY 2025 revenue | $1.18B | $46.8M | 25.2× |
| Market cap / FY 2026 guidance | $1.18B | $360M | 3.3× |
| Tuesday value gain / FY26 guide | ≈$211M | $360M | 0.59× |
| Analyst target / close | $10.50 avg. | $2.96 | 3.55× |
Five-analyst consensus: Strong Buy; target range $7–$15. Targets predate this catalyst.
Investor read: Google validates the technology, but September must validate economics. Watch recognized revenue, gross margin, cash conversion, outstanding shares and continued support for the $360 million outlook.
Sources: Rezolve AI investor releases dated July 27, August 6 and August 25, 2026; Rezolve AI 2025 Form 20-F; S&P Global Market Intelligence and Nasdaq UTP data displayed by StockAnalysis. Derived figures may differ due to rounding.
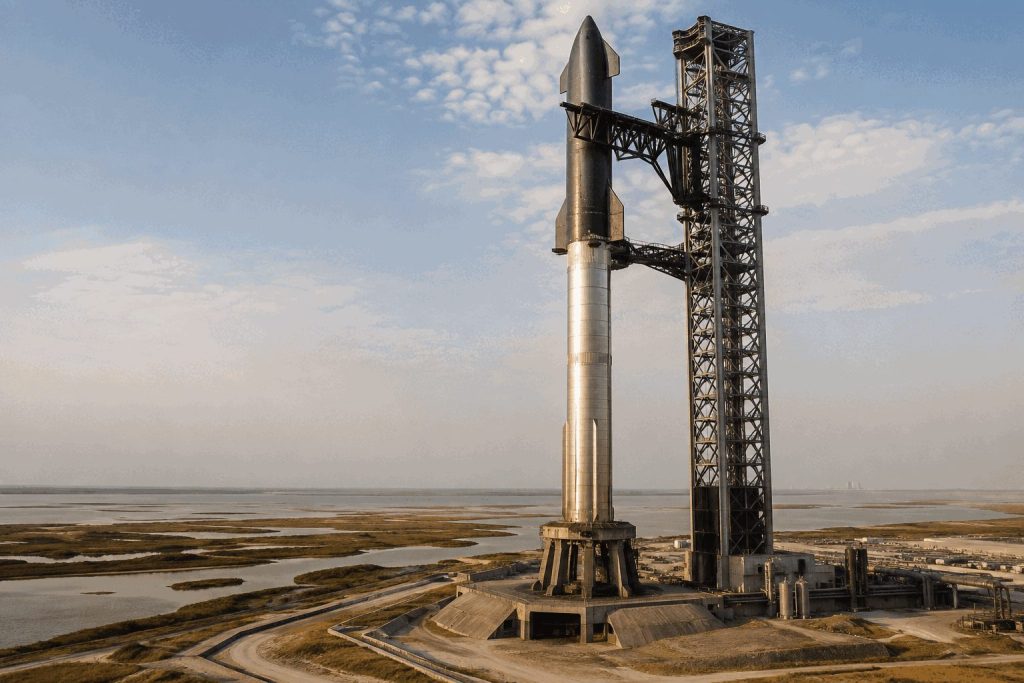
PECAN ISLAND, Louisiana, August 25, 2026, 21:30 EDT — SpaceX's Starbase Louisiana is preparing to meet a $100 billion capital expenditure test, with the…
The planned commitment equals 5.3% of market value, 4.3 times trailing revenue and 5.4 quarters of the latest capital-spending pace.
| Site | 125,000 acres |
| Launch complexes | 5 |
| Launch pads | 10 |
| Direct jobs | 3,000 |
| Average salary | $92,600 |
| Indirect jobs | 8,100 |
| Direct local payments | >$820M |
More Starship slots can expand satellite deployment and payload revenue. Cash flow depends on launch reliability, customer demand and the final spending schedule.
| Q2 revenue | $7.81B |
| Revenue growth | 92% |
| Adjusted EBITDA | $3.54B |
| Net loss | $541M |
| Q2 capex | $18.37B |
| Backlog | $47.5B |
| Average target | $213.50 |
| Low target | $75 |
| High target | $450 |
| Forward P/E | 106.3× |
Sources: Louisiana Economic Development, Reuters, SpaceX's August 4 SEC filing, StockAnalysis and S&P Global analyst data. Calculations use the August 25 close and approximately 13.57 billion shares. Figures may not sum because of rounding.
SANTA CLARA, California, August 25, 2026, 20:45 EDT — Nvidia stock advanced 2.2%, while options traders positioned for a $280 billion change in market…
The 5.4% move equals about $11.50 per share. It is an options estimate, not a forecast or a guaranteed trading range.
Fiscal Q2 FY27 results
17:00 EDT · 14:00 PDT
Conference call and webcast
At Tuesday's close, the 7.4% historical response equals about ±$15.77 and roughly $382 billion of equity value.
The $280 billion implied equity swing is roughly 3.1 times Nvidia's $91 billion quarterly revenue guide.
A modest change in revenue growth or margin expectations can therefore move more value than several quarters of sales.
| Metric | Reference |
|---|---|
| Q1 revenue | $81.6B |
| Year-over-year growth | 85% |
| Data Center revenue | $75.2B |
| Data Center growth | 92% |
| Q2 revenue guide | $91.0B ±2% |
| Q2 non-GAAP margin | 75.0% ±0.5 pt |
| Average target | $304.73 |
| Target range | $180–$500 |
| Forward P/E | 20.77 |
Sources: Nvidia investor relations, Reuters options-market reporting, StockAnalysis and S&P Global analyst data. Calculations use the August 25 close of $213.05 and approximately 24.22 billion shares. Figures may not sum because of rounding.
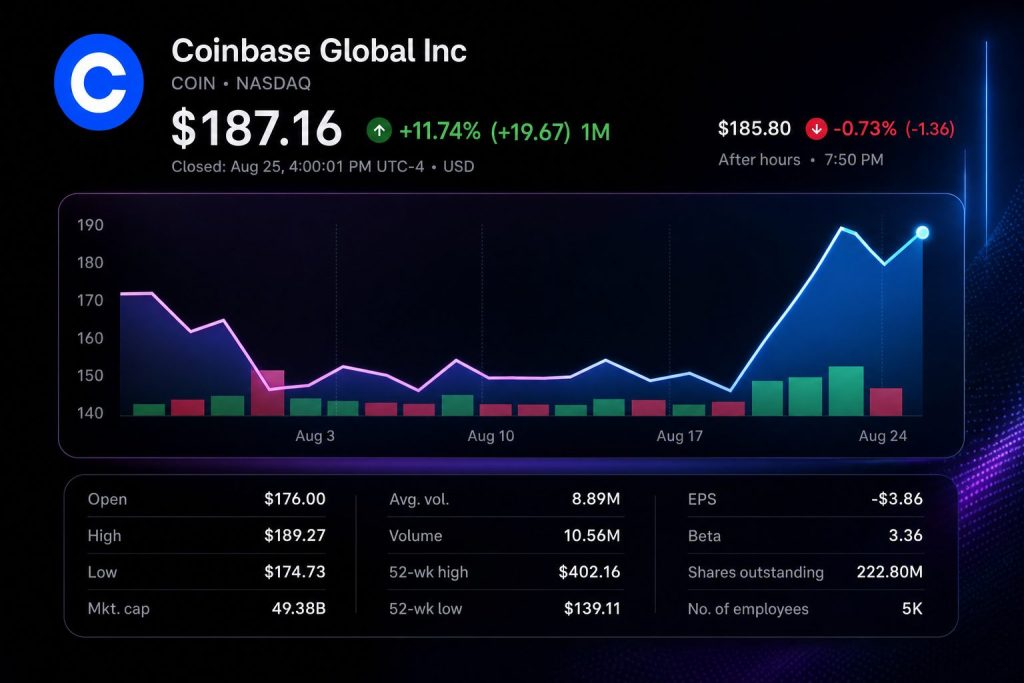
Coinbase Global rose $7.68, or 4.28%, to $187.16 on Tuesday. Volume reached 10.55 million shares. The move added roughly $2.03 billion to quoted equity…
| Metric | Reading | Period |
|---|---|---|
| Total revenue | $1.22B | Q2 2026 |
| Subscription & services | $555M | Q2 2026 |
| Share of net revenue | 48% | Q2 2026 |
| Adjusted EBITDA | $207.8M | Q2 2026 |
| Net loss | −$359.5M | Q2 2026 |
| Trading-volume share | 10.3% | Q2 2026 |
Interpretation: Base can distribute the assets across wallets and DeFi protocols. The investor case still needs disclosed volume, take rate and contribution margin.
| Company | August 25 close | Day move | Market cap | Forward P/E | Analyst target upside |
|---|---|---|---|---|---|
| Coinbase | $187.16 | +4.28% | $49.38B | 162.8× | +5.0% |
| Cboe Global Markets | $308.82 | +0.24% | $32.25B | 21.3× | +2.1% |
| Intercontinental Exchange | $161.78 | −0.74% | $90.82B | 19.7× | +14.6% |
| Nasdaq | $98.73 | −0.06% | $55.19B | 22.6× | +11.2% |
| CME Group | $277.32 | −0.66% | $99.72B | 22.5× | +2.1% |
Peer data are as of the August 25 U.S. close. The comparison shows Coinbase's greater earnings sensitivity to digital-asset activity and product adoption.
Consensus across 34 analysts, with an average target of $196.55.
The target implied 5.0% upside from the August 25 close. That is smaller than the stock's single-day 4.28% move.
Tuesday's price action treated tokenized equities as a credible extension of Coinbase's platform. The measurable evidence is the stock move, not product revenue. With only four securities and no disclosed fee schedule, adoption data now matter more than launch-day attention.
Shares in Madison Air Solutions Corporation rose 12.09% on Tuesday following the company’s resolution of a key financing hurdle in its intended purchase of…
Market data through August 25, 2026, 16:00 EDT
Tuesday’s close was 12.1% above the private-placement price.
The placement removes the equity-funding overhang. Debt service and synergy delivery become the next valuation tests.
| Measure | Q2 / latest | Signal |
|---|---|---|
| Net sales | $991.3M | +21% |
| Adjusted EBITDA | $265.8M | +18% |
| Adj. EBITDA margin | 26.8% | -70 bp |
| Backlog | $2.87B | +133% |
| Free cash flow | $89.6M | 9.0% of sales |
| New shares | 90.1M |
| Estimated pre-deal base | ~490M |
| Increase versus base | ~18.4% |
| New shares / enlarged total | ~15.5% |
| Insider-affiliated commitments | $620M |
Share-base figures are estimates derived from the April IPO valuation because Madison Air has multiple share classes.
| Target | Value |
|---|---|
| 2026 sales | $3.825B–$3.925B |
| 2026 adjusted EBITDA | $1.020B–$1.065B |
| Annual cost synergies | At least $160M |
| Post-close net leverage | ~3.7× |
| Two-year leverage goal | <2.5× |
| Firm | View | Target |
|---|---|---|
| Stifel | Buy | $41 |
| Barclays | Overweight | $45 |
| RBC | Outperform | $48 |
| Baird | Outperform | $48 |
Positive: placement closes near September 1; acquisition approvals stay on schedule; backlog converts without margin erosion. Watch: debt pricing, interest expense and public-float expansion. Risk: slower synergies or regulatory delay would weaken the planned deleveraging path.
Sources: Madison Air August 25 placement release, August 17 acquisition announcement and July 30 second-quarter results; Reuters IPO and acquisition reporting; Yahoo Finance closing data. Figures labeled estimates are calculated from disclosed inputs.
MOUNTAIN VIEW, California, August 25, 2026, 16:24 EDT — Shares of Intuit fell more than 7% after the company forecast a 9%-10% increase in…
| Metric | Actual | Street | Beat |
|---|---|---|---|
| Revenue | $4.354B | $4.27B | +2.0% |
| Adjusted EPS | $4.03 | $3.58 | +12.6% |
| Online Ecosystem | $2.6B | — | +17% YoY |
| Credit Karma | $743M | — | +16% YoY |
The definition change narrows the apparent EPS miss. The revenue midpoint of $4.304B still trails the $4.35B consensus by about 1.1%.
| Firm / group | Rating | Target | Upside vs close |
|---|---|---|---|
| Jefferies | Buy | $500 | 39.3% |
| Citi | Buy | $457 | 27.3% |
| 35-analyst avg. | Buy | $446.02 | 24.3% |
| TD Cowen | Hold | $328 | −8.6% |
Shares of Oklo Inc. rose 11.5% on Tuesday, as renewed U.S.-Canada trade friction renewed concerns over uranium supply, impacting advanced-nuclear stocks. Oklo finished the…
Market close · August 25, 2026 · 16:00 EDT
Ontario named uranium as possible trade leverage. Oklo rallied, though no cutoff or new Oklo contract was announced.
The session's added value equaled 6.7× Oklo's $126.9M first-half capital spending. That is a sentiment move, not realized cash flow.
| Metric | Amount |
|---|---|
| Cash + marketable securities | $3.01B |
| H1 ATM equity proceeds | $1.85B |
| H1 operating cash use | $65.5M |
| H1 capital spending | $126.9M |
| 2026 operating cash-use guide | $120–150M |
| 2026 PP&E guide | $400–500M |
Balance-sheet figures through June 30, 2026. Source: Oklo Form 10-Q and Q2 call.
| Measure | Target / view |
|---|---|
| Consensus | Buy · 15/9/1 |
| Average target | $79.88 · +80% |
| Median target | $81.50 · +84% |
| Truist | Hold · $51 |
| H.C. Wainwright | Buy · $90 |
| Canaccord | Buy · $100 |
Latest compiled targets available August 25; recent firm calls dated August 10.
Policy riskHALEU accessGroves executionAurora scheduleEquity dilution
Oklo has enough liquidity to fund near-term work, but its $8.23B value still depends on regulatory progress and future commercial deployment. The uranium threat supports the strategic case for domestic fuel. It does not itself create revenue. A reversal in trade rhetoric could therefore unwind part of Tuesday's gain.
Sources: Yahoo Finance close and volume; Oklo Q2 2026 Form 10-Q; Oklo Groves first-criticality release; Reuters and AP trade reporting; S&P Global analyst compilation. All market figures as of August 25, 2026, 16:00 EDT.
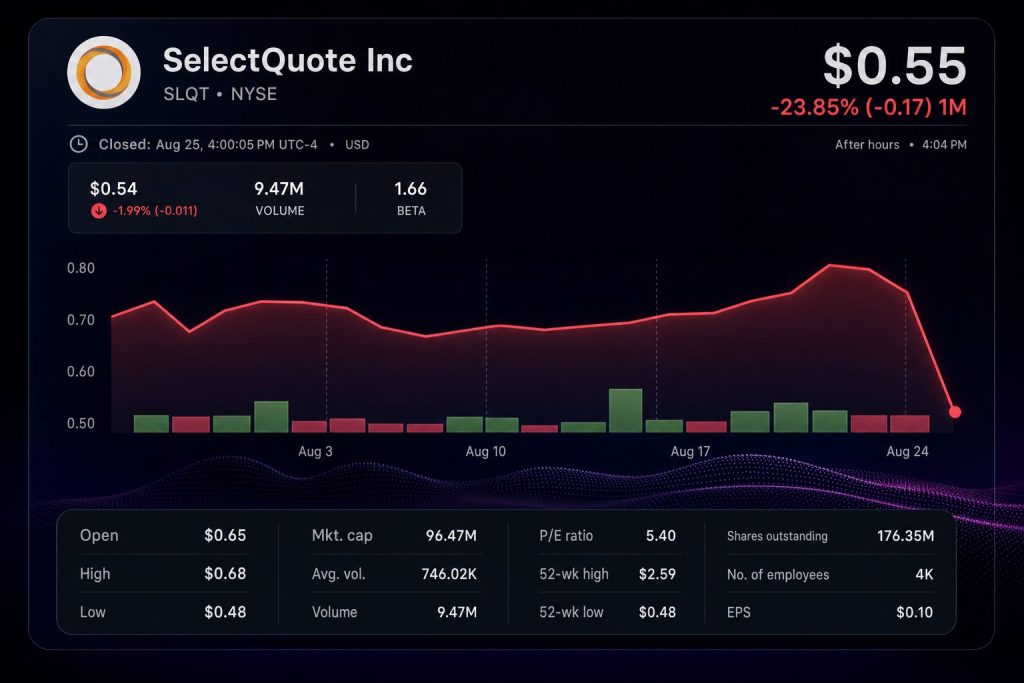
OVERLAND PARK, Kansas, August 25, 2026, 16:00 EDT — SelectQuote shares slumped 30% after the company projected lower-than-anticipated revenues for 2027, deepening its struggle…
| Revenue | $321.7M | −7% |
| Revenue vs consensus | −$31.7M | −9.0% |
| Net result | −$16.8M | from +$12.9M |
| Adjusted EBITDA | $11.9M | from $2.7M |
| Segment / metric | Q4 FY26 | YoY |
|---|---|---|
| Senior revenue | $72.5M | −12% |
| Approved MA policies | 72,180 | −15% |
| Healthcare Services revenue | $193.5M | −10% |
| SelectRx members | 109,039 | +1% |
| Prescriptions per day | 31,711 | +3.5% |
| Life adjusted EBITDA | $9.8M | +41% |
| Management target | FY2027 | Signal |
|---|---|---|
| Revenue | $1.35B–$1.45B | −9% to −16% |
| Adjusted EBITDA | $90M–$115M | midpoint −6% |
| Operating cash flow | >$60M | about 2× |
| Free cash flow | ≈$50M | new target |
| Annual tech savings | >$30M | execution needed |
| Source | Rating | Target | Date |
|---|---|---|---|
| Craig-Hallum | Buy | $3.00 | Feb 6 |
| RBC | Hold | $5.00 | Nov 20 |
| Jefferies | Hold | $2.00 | Nov 10 |
| 4-analyst consensus | Buy | $3.06 | Aug 25 |
| Cash and restricted cash | $20.7M |
| Current + long-term debt | $370.2M |
| Preferred carrying value | $298.2M |
| Preferred liquidation preference | $423.2M |
| FY2026 operating cash flow | $31.9M |
The market is valuing cash-flow execution over member growth. SelectRx prescriptions rose, but consolidated revenue contracted and the new guide sits well below consensus. The next proof points are delivery of more than $60 million in operating cash flow, realization of at least $30 million in savings, and a sustained recovery toward the NYSE's $1 minimum.
CoreWeave, Inc. shares climbed 2.32% on Tuesday as Rescale integrated its AI cloud with a digital-engineering platform utilized in five sectors. Shares changed hands…
Market snapshot: August 25, 2026, 13:12 EDT · U.S. regular session. Partnership announced August 25, 2026.
Commercial terms, minimum usage and contract duration were not disclosed. The value lies in workload access; monetization still requires consumption.
$104B backlog compared with $48.67B equity value. Backlog converts only as capacity becomes available and services are delivered.
| Metric | Q2 2026 | YoY / margin |
|---|---|---|
| Revenue | $2.575B | +112% |
| Adjusted EBITDA | $1.510B | 59% margin |
| Operating loss | $49M | -2% margin |
| Net loss | $626M | -24% margin |
| Interest expense | $640M | 24.9% of revenue |
| Property purchases | $6.422B | 2.49× revenue |
June 30, 2026. Debt is the sum of current and long-term recourse and non-recourse balances.
| Firm / set | Date | Rating | Target | Upside / downside |
|---|---|---|---|---|
| 38-analyst consensus | Aug. 25 | Buy | $144.17 | +63% |
| Truist | Aug. 19 | Buy | $155 | +76% |
| Goldman Sachs | Aug. 20 | Hold | $139 | +58% |
| Barclays | Aug. 13 | Hold | $105 | +19% |
| Bernstein | Aug. 12 | Sell | $74 | -16% |
Rescale adds a distribution layer for compute-heavy engineering. CoreWeave can diversify workload types while reusing the same GPU, networking and storage stack. Revenue growth above 100% and a backlog twice the equity value create substantial operating leverage if utilization rises.
No commercial value was disclosed. Debt is more than six times cash, interest consumed nearly one quarter of quarterly revenue, and property purchases were 2.5 times revenue. Slow deployments or weak utilization can make new demand expensive to serve.
Sources: CoreWeave–Rescale announcement; CoreWeave Q2 results; StockAnalysis market data; analyst consensus. Figures timestamped as shown; calculations by TS2.
SAN JOSE, California, August 25, 2026, 12:01 EDT - Shares of Bloom Energy climbed 5% after a disclosure from the Pelosi household contributed to…
Bloom snapshot: August 25, 2026, 12:01 EDT · U.S. regular session · Peer snapshots: 11:34 EDT
+5.43% from a $204.02 prior close.
About $3.26B added during the move.
Shares traded by 12:01 EDT.
Growth expectations leave little room for execution slippage.
This compares current underlying share exposure, not the option premiums paid. The stock move is an attention signal; it does not create revenue or contracts.
Reported ranges total $3M–$12M. Exact option premiums are not disclosed.
| Metric | Q2 2026 | Q2 2025 | Change |
|---|---|---|---|
| Revenue | $1.065B | $401.2M | +165.5% |
| Product revenue | $935.4M | $296.6M | +215.4% |
| GAAP gross margin | 33.4% | 26.7% | +6.7 pts |
| GAAP operating income | $182.2M | -$3.5M | +$185.7M |
| Operating cash flow | $226.4M | -$213.1M | +$439.5M |
Consensus Buy · Average target $275.08 · 27.9% implied upside from $215.10.
| Analyst | Rating | Target | Implied return | Date |
|---|---|---|---|---|
| Bernstein | Hold | $282 | +31.1% | Aug. 18 |
| J.P. Morgan | Buy | $314 | +46.0% | Aug. 3 |
| Wells Fargo | Hold | $176 | -18.2% | July 30 |
| Mizuho | Buy | $242 | +12.5% | July 30 |
The full 29-analyst range runs from $97 to $390. That dispersion reflects both AI-power growth and valuation risk.
| Company | Price | Daily move | Market value | TTM revenue | Net income |
|---|---|---|---|---|---|
| Bloom Energy (NYSE: BE) | $215.10 | +5.43% | $63.35B | $3.11B | $244.9M |
| Plug Power (NASDAQ: PLUG) | $2.275 | +4.84% | $3.18B | $744.1M | -$1.64B |
| FuelCell Energy (NASDAQ: FCEL) | $19.59 | +4.48% | $1.57B | $167.9M | -$225.5M |
Bloom leads on scale and profitability. Similar peer gains suggest the disclosure also lifted attention across fuel-cell equities.
The disclosed purchases occurred about one month before the market reaction. They do not alter Bloom's contracts, backlog or cash. The stock trades near 62× forward earnings and remains 39% below its 52-week high. AI construction delays, permitting friction, manufacturing defects or margin slippage could compress the multiple.
Sources: Bloom market data, price history, analyst consensus, Bloom Q2 results, congressional transaction records, PLUG data and FCEL data. Time-sensitive figures are stamped August 25, 2026, 11:34–12:01 EDT.
Shares of T3 Defense Inc. surged 22.34% on Tuesday following Noble Capital’s decision to increase its price target to $30. The market reaction was…
| Measure | Actual | Noble estimate |
|---|---|---|
| Q2 revenue | $4.0M | $4.5M |
| Gross margin | 25.4% | 11.1% |
| Operating loss | $3.4M | $3.9M |
| Recommendation | Outperform | Target $30, from $20 |
Noble’s research is company-sponsored. The target implies about $49.9M of equity value using the August 14 share count, before potential dilution.
| Metric | Verified figure | Read-through |
|---|---|---|
| 1H revenue | $7.65M | Acquisition-led revenue base |
| 1H gross profit | $1.40M | 18.4% gross margin |
| Operating cash use | $9.79M | Exceeds June cash |
| Cash & equivalents | $4.09M | Funding remains material |
| Warrant liabilities | $124.39M | Non-cash volatility and dilution complexity |
Rimon’s figures are preliminary and unaudited. Its new mobile UAV/counter-UAV line has no disclosed orders yet.
| Catalyst / risk | Current evidence | Next proof point |
|---|---|---|
| Analyst rerating | Outperform; target raised to $30 | Orders and estimate revisions |
| Margin execution | Q2 25.4% vs. Noble 11.1% | Repeat margin in Q3 |
| Liquidity | $4.09M cash; $9.79M 1H operating use | Cash conversion or new financing |
| Listing | Equity below Nasdaq’s $10M threshold | Compliance plan due October 5 |
| Micro-float volatility | 9.42M volume on 1.66M shares | Turnover and price stability after catalyst |
Bottom line: Tuesday’s rebound prices in improved operating margins and Noble’s higher target. The durable case still needs booked orders, cash generation and a credible Nasdaq compliance path.
Stock Analysis real-time market data · Noble Capital research summary · T3 Defense 10-Q · Nasdaq compliance 8-K · Rimon operating update