
Flutter shares climb 7.1% as FanDuel’s $350 promotion puts spotlight on marketing spend
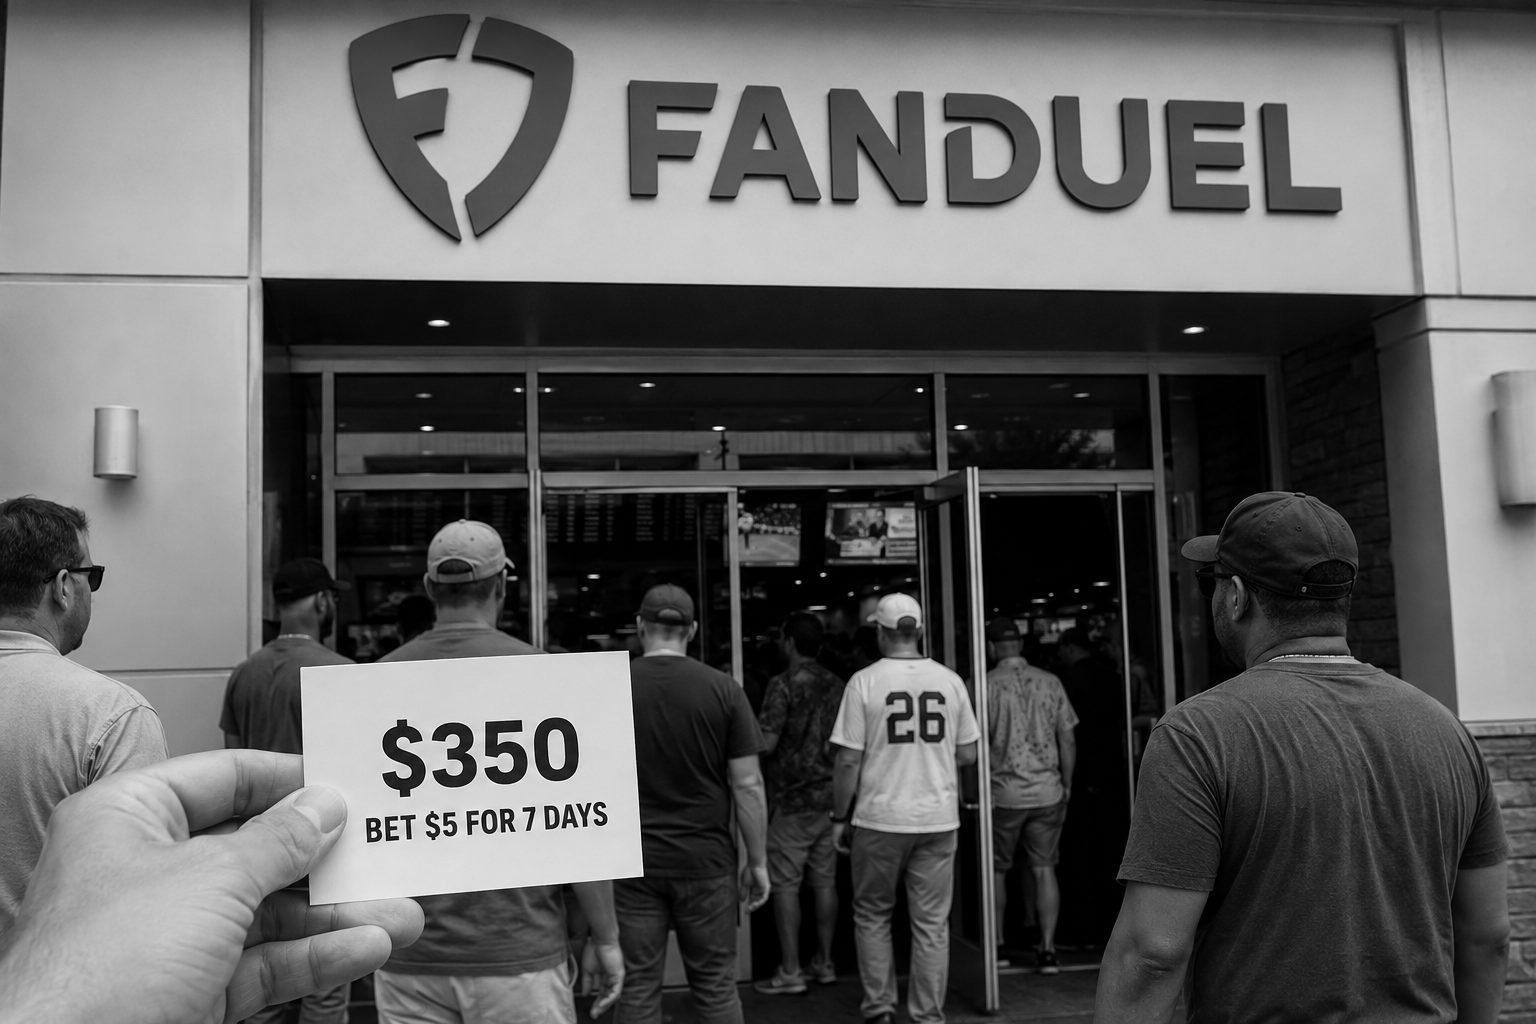
NEW YORK, August 30, 2026, 06:01 – Flutter shares rose 7.1% after its FanDuel unit introduced a $350 new customer bonus, underscoring increasing competition…
All coverage
NEW YORK, August 30, 2026, 06:01 – Flutter shares rose 7.1% after its FanDuel unit introduced a $350 new customer bonus, underscoring increasing competition…
The funnel expanded, but each dollar of handle produced less net revenue. Retention after the seven-day offer is the key return metric.
Implied promotional spend equals reported 5.4% of $11.96B handle; it is not a separately reported expense.
| Metric | Q2 2026 | Q2 2025 | Signal |
|---|---|---|---|
| Total revenue | $1.683B | $1.791B | -6% |
| Sportsbook revenue | $1.039B | $1.219B | -15% |
| iGaming revenue | $577M | $507M | +14% |
| Sales & marketing | $353M | $219M | +61% |
| Adjusted EBITDA | $119M | $400M | -70% |
| Adjusted EBITDA margin | 7.1% | 22.3% | -15.2pp |
| Consensus | Overweight |
| Buy / Overweight / Hold / Sell | 23 / 2 / 9 / 1 |
| Average target | $135.26 |
| Implied upside | 32.9% |
| 52-week range | $89.71–$300.92 |
| Friday volume / average | 1.03× |
Risks: bonus churn, sports outcomes, higher state taxes, prediction-market competition and management transition.
FanDuel can spend $350 to create attention. Flutter's return depends on repeat wagering after the seventh day while promotional intensity retreats from 5.4% of handle.
Sources: FanDuel promotions; Flutter Q2 2026 SEC exhibit; Google Finance; FactSet via WSJ; NFL Football Operations. Figures rounded.
Intel Corporation shares fell 2.85% Friday as investors weighed promising Intel 14A manufacturing data against a still-heavy foundry loss.
Quarter ended June 27, 2026.
| Measure | Q2 2026 |
|---|---|
| Revenue | $5.77B |
| Revenue growth | +31% YoY |
| Operating loss | $2.09B |
| Loss / revenue | 36.2% |
| Prior-year loss | $3.17B |
| Total revenue | $16.1B · +25% |
| DCAI revenue | $6.3B · +59% |
| Client revenue | $8.9B · +13% |
| Non-GAAP gross margin | 41.8% |
| Operating cash flow | $7.0B |
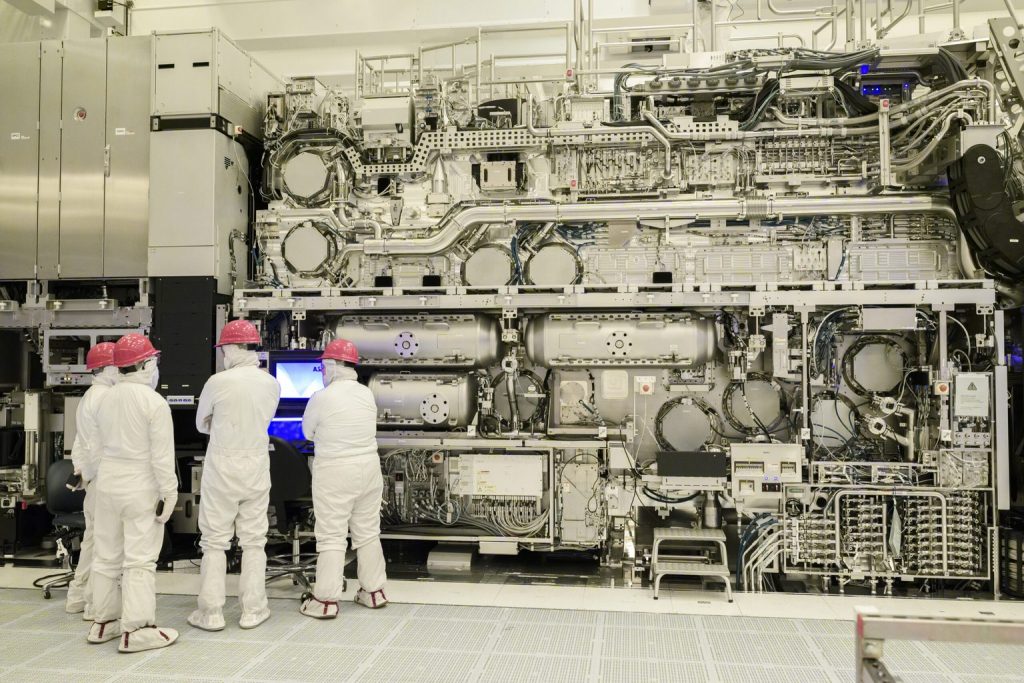
Intel 14A combines second-generation RibbonFET transistors, PowerDirect backside power delivery and High-NA EUV. The architecture can improve density and power efficiency, but defect data must convert into repeatable yield and customer volume.
Defect density is not the same as finished-die yield. The 2028 schedule leaves execution risk. Expensive lithography tools raise depreciation. External commitments remain essential for acceptable returns on 14A investment.
The 14A defect curve is Intel's strongest manufacturing signal in years. Yet the market still sees a $2.09 billion quarterly Foundry loss and a two-year runway to volume production. The next re-rating requires named external customers, disclosed capacity commitments and evidence that yield gains reduce cost per good die.
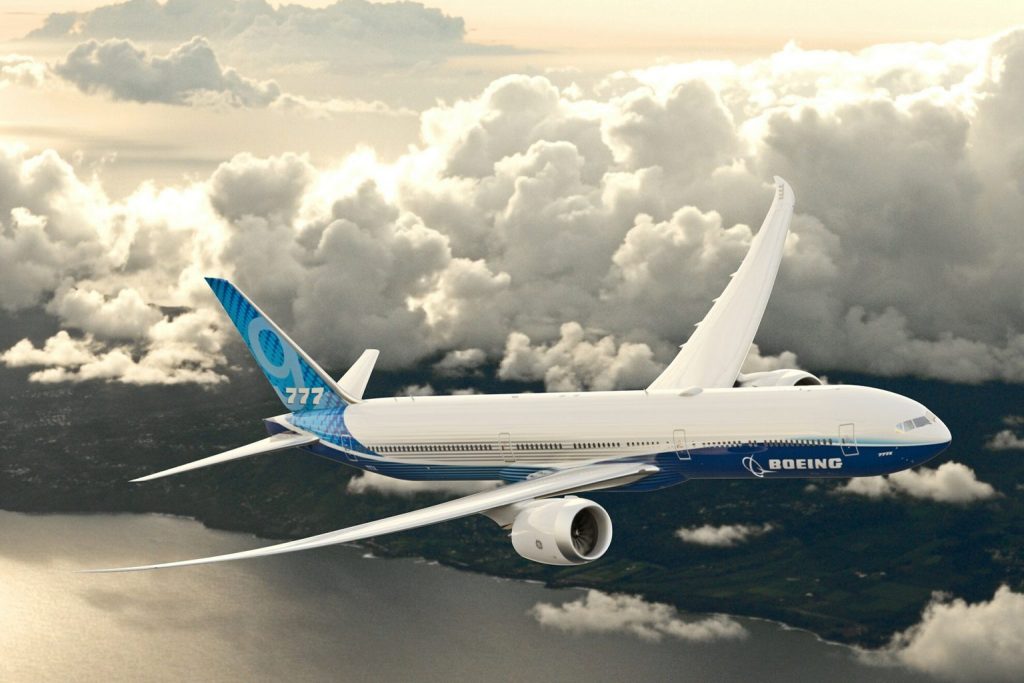
The labor issue matters because certification depends heavily on the same technical workforce. SPEEA members overwhelmingly rejected Boeing’s offer last week. Their current agreement…
| Signal | Latest | Read-through |
|---|---|---|
| 777-9 delivery | 2027 target | Seven-year slip keeps execution discount alive |
| Engineering labor | 17,000 workers; talks Monday | Certification capacity becomes the immediate swing factor |
| Customer protection | Compensation and rejection rights | Another delay can raise cash and accounting costs |
| Aircraft economics | 20% lower fuel/emissions | Airline demand remains the program’s strongest support |
| Target range | $246–$305 | Even the low target implies 17% upside from $209.82 |
Monday: Boeing and SPEEA resume negotiations. Watch for guaranteed-wage movement and evidence of a workable bargaining path.
Certification: Extended operations and function-and-reliability testing follow the seventh aircraft’s first flight.
October 6: Contract expiry. A work stoppage would threaten both 777-9 and 737 MAX 10 timelines.
PayPal Holdings Inc. lost about $6.7 billion of market value Friday. The stock fell 12.71% after the Stripe-Advent takeover effort ended.
NASDAQ: PYPL · stock move and operating reset
Upside: stronger branded checkout, $1.8 billion quarterly free cash flow and a discounted multiple.
Pressure: Apple Pay and Shop Pay competition, margin contraction and limited account growth.
Next dates: ex-dividend September 4; quarterly dividend payment September 25.
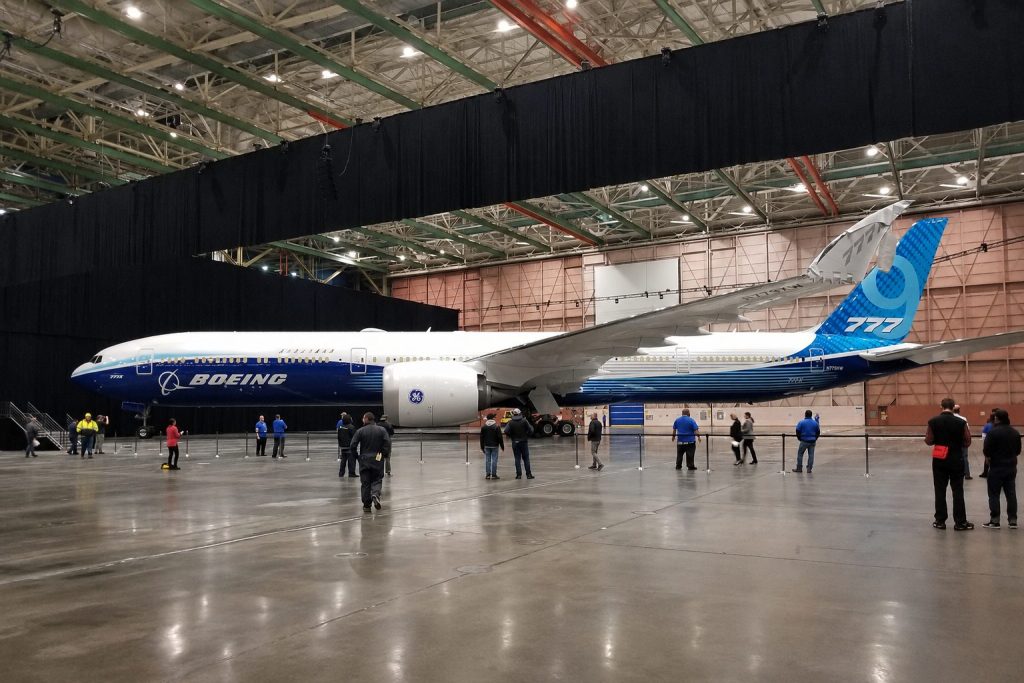
Boeing’s 777-9 is nearing another crucial phase in certification. Over 620 777X orders are pending as the company aims for a first delivery in…
Certification progress versus margin, cash and labor risk
Market data: Aug. 28, 2026, 16:00 EDT
Program data through Aug. 29, 2026, 09:48 EDT
Group revenue grew 8%. Commercial losses narrowed, but the division still lost $322 million.
| Measure | Latest |
|---|---|
| Market value | $165.84B |
| 52-week range | $176.77–$254.35 |
| Range position | 42.6% |
| Q2 free cash flow | $631M |
| Q2 2025 free cash flow | -$200M |
| Debt, June 30 | $45.9B |
| Debt, March 31 | $47.2B |
| Analyst coverage | 32 ratings* |
*Accessible source gave the count, not a reliable recommendation split; no consensus is inferred.
The 777X represents about one in ten commercial backlog units. A clean certification finish can improve delivery mix and cash conversion. Another delay would keep inventory and customer-compensation risk elevated.
FAA findings, flight-test rework, supplier constraints and a labor stoppage could shift delivery timing. Program-level profitability is not disclosed, so backlog volume cannot be translated directly into earnings.
Sources: Boeing Q2 results · Boeing 777-9 update · Reuters labor report · MarketWatch close
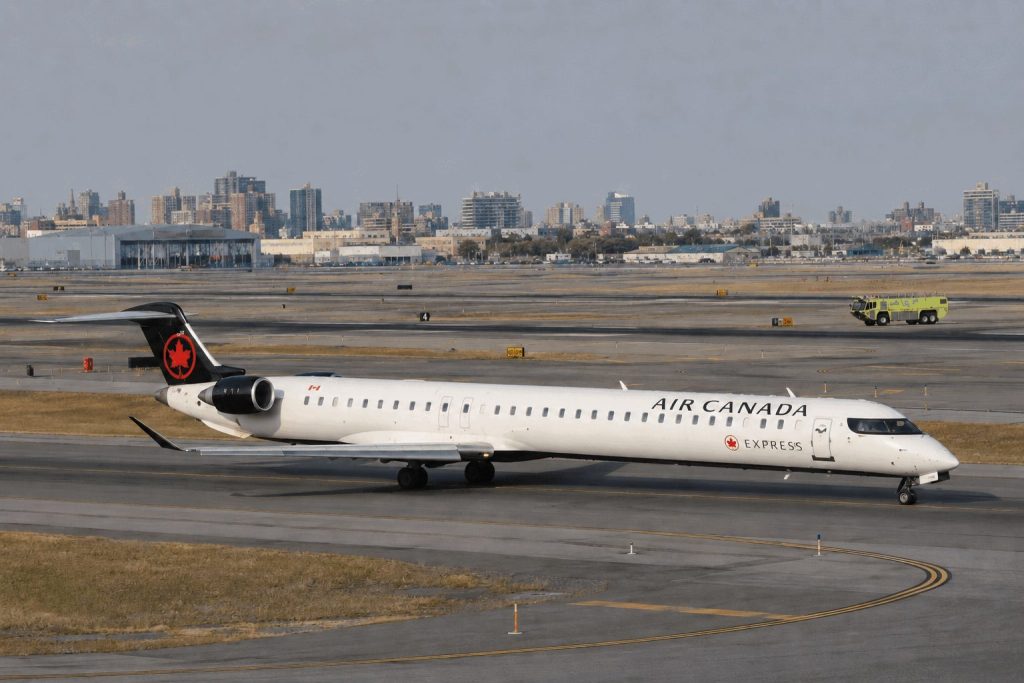
Air Canada shares fell 1.46% on Friday as fresh enforcement action revived scrutiny of a fatal LaGuardia Airport collision. The move erased roughly C$115…
The FAA moved to dismiss two controllers who allegedly left LaGuardia early before the March 22 Air Canada Express collision.
The action targets controllers. The NTSB has not assigned final cause, limiting any direct attribution to Air Canada.
| Q2 2026 | Value |
|---|---|
| Revenue | C$6.266B |
| Operating loss | C$215M |
| Operating margin | −3.4% |
| Adjusted EBITDA | C$719M |
| Adjusted EBITDA margin | 11.5% |
| Signal | Verified fact | Investor reading |
|---|---|---|
| LaGuardia load | 70 flights handled in 97 minutes vs 31 scheduled | Staffing and system-resilience question |
| Accident impact | 2 pilots killed; 6 serious injuries; 39 hospitalized | Legal, insurance and brand exposure |
| Transborder franchise | 50 U.S. airports; up to 382 daily flights | Material route network under scrutiny |
| Valuation cross-check | Aeroplan implied value: C$10B | Above Air Canada’s C$7.77B equity value |
Final NTSB findings are pending. A controller-focused action may not translate into airline liability. Fuel costs, the reduced EBITDA range and weak operating margin remain more direct earnings variables.
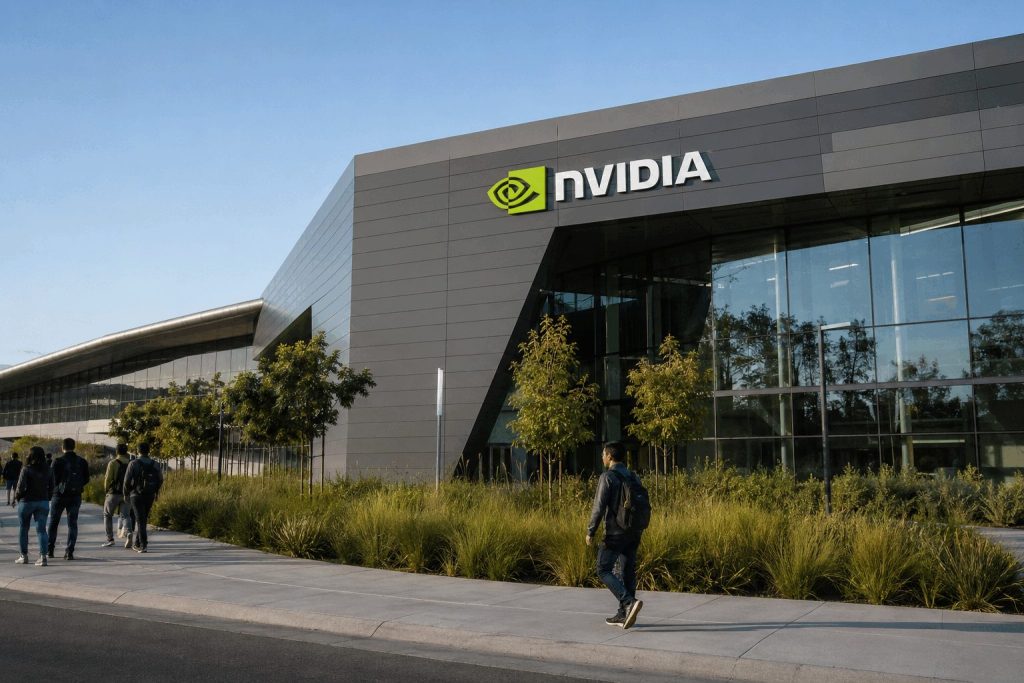
SANTA CLARA, August 28, 2026, 17:50. Nvidia shares closed down 4.6%, losing $253 billion in market value, as investors focused on margin risks despite…
| Metric | Q1 FY27 | Q2 FY27 | Q3 guide |
|---|---|---|---|
| Revenue | $81.6B | $96.2B | $108.0B ±2% |
| Seq. growth | 20.0% | 17.9% | 12.2% |
| Gross margin | 74.9% | 75.0% | 74.0% ±0.5 pt |
| Data center | $75.2B | $89.0B | Not guided |
| Consensus | Buy |
| Ratings mix | 57 Buy · 7 Overweight · 2 Hold · 1 Sell |
| Median target | $316.60 · 45.5% above close |
| Q2 capital returned | $26.0B |
| Remaining repurchase authority | $99.0B |
Sources: NVIDIA Q2 FY2027 release; Reuters, Aug. 27–28, 2026; FactSet via WSJ/MarketWatch. Market figures are time-sensitive and stated as of the timestamps above.
NEW YORK, August 28, 2026, 14:50 EDT - Gold mining stocks slid 4.6% after a surprise move on interest rates by Warsh pressured the…
| Q2 metric | Value |
|---|---|
| Realized gold price | $4,414/oz |
| By-product AISC | $1,621/oz |
| Pre-overhead spread | $2,793/oz |
| Free cash flow | $2.2bn |
| Net cash | $3.4bn |
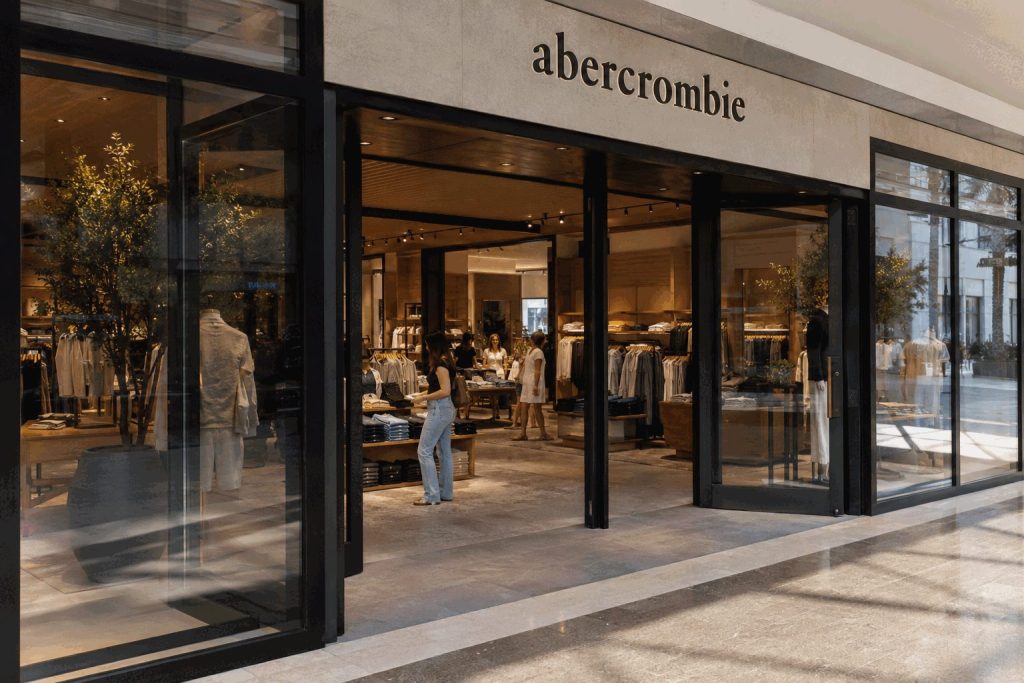
NEW ALBANY, Ohio, August 28, 2026, 14:35 EDT — Abercrombie & Fitch shares gained 36% following a $500 million stock repurchase that lowered the…
| Metric | Q2 result |
|---|---|
| Net sales | $1.267B, +5% |
| Comparable sales | Flat |
| Operating income | $253M |
| Operating margin | 19.9% |
| Reported diluted EPS | $4.17 |
| Approx. EPS ex-refund | $2.42 |
| Brand | Sales growth | Comp |
|---|---|---|
| Abercrombie | +8% | +4% |
| Hollister | +2% | −3% |
| Total company | +5% | 0% |
| Reported lift | Magnitude |
|---|---|
| Operating-margin benefit | 790 basis points |
| Diluted EPS benefit | $1.75 |
| Implied margin without benefit | ≈12.0% |
| Measure | Value |
|---|---|
| Q2 repurchases | $177M / 2.0M shares |
| Year-to-date repurchases | $282M / 3.2M shares |
| YTD share-count reduction | 7% of beginning shares |
| Remaining authorization | $568M |
| Cash | $628M |
| Total liquidity | $1.1B |
| First-half operating cash flow | $313M |
| Period | Guidance |
|---|---|
| Fiscal 2026 sales growth | ≈5% |
| Fiscal 2026 EPS | $13.10–$13.60 |
| Q3 sales growth | 5%–6% |
| Q3 EPS | $2.90–$3.20 |
| Q3 repurchases | At least $100M |
| FactSet view | Count / price |
|---|---|
| Buy | 8 |
| Hold | 7 |
| Average target | $162.90 |
| Median target | $162.50 |
| Range | $134–$185 |
The durable part of the story is the shrinking denominator: management plans at least $500 million of 2026 repurchases, equal to about 7.4% of market value. The less durable part is the margin headline. Removing the refund implies roughly a 12% operating margin, while flat total comps leave future gains dependent on brand execution and disciplined capital returns.
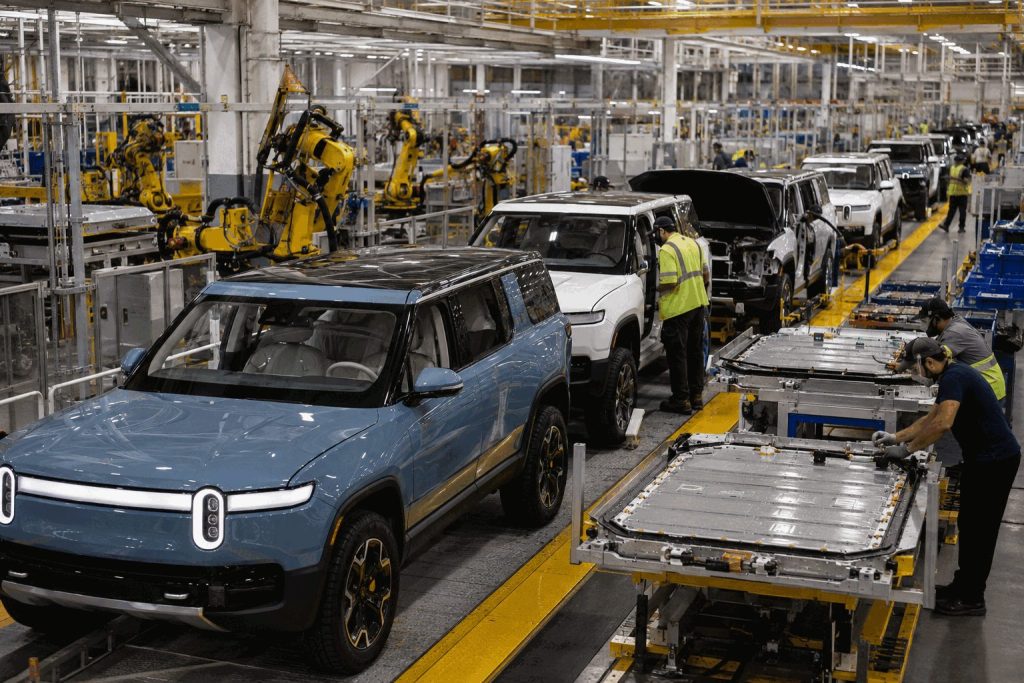
Rivian Automotive stock dropped 6.49% on Friday following news that the company's finance chief intends to step down amid the R2 production ramp-up.
| Measure | Reading |
|---|---|
| Q2 vehicles produced | 12,613 |
| Q2 vehicles delivered | 12,194 |
| 2026 delivery guidance | 65,000–70,000 |
| Guidance midpoint | 67,500 |
| Software/services revenue | $515M, +37% |
| Software/services gross margin | 42% |
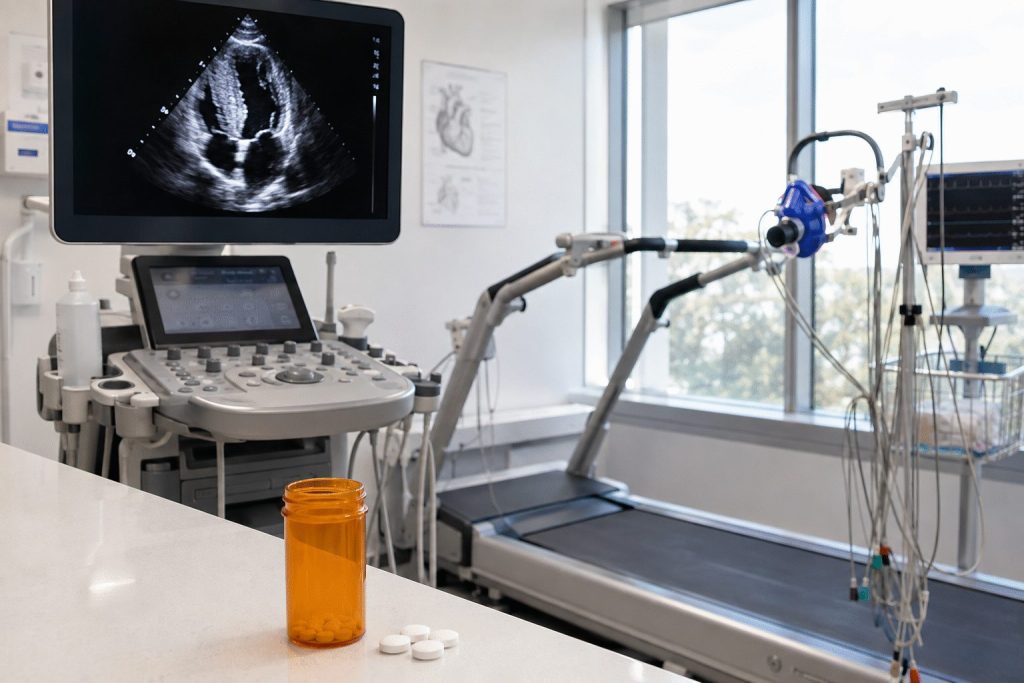
Cytokinetics shares fell after reporting the first positive Phase 3 trial results in non-obstructive hypertrophic cardiomyopathy. The market response indicates investors were looking for…
| Endpoint | MYQORZO | Placebo | Net effect | p-value |
|---|---|---|---|---|
| KCCQ-CSS | +11.4 | +8.4 | +3.0 pts | 0.021 |
| Peak VO2 | +0.64 | −0.03 | +0.67 ml/kg/min | 0.003 |
| NYHA class improvement | 41.9% | 27.8% | +14.1 pts | <0.001 |
| NT-proBNP ratio | 0.43 | 1.00 | 0.43 | <0.001 |
Left-atrial volume and time to first cardiovascular event did not reach significance. Two treated patients had serious heart-failure events associated with LVEF below 50%.
Q2 product cost was $2.7M. Early inventory and launch timing limit direct run-rate comparisons.
Investor lens: the Phase 3 win expands MYQORZO's possible revenue base, but Friday's decline prices in questions about clinical magnitude, monitoring burden and launch spending.
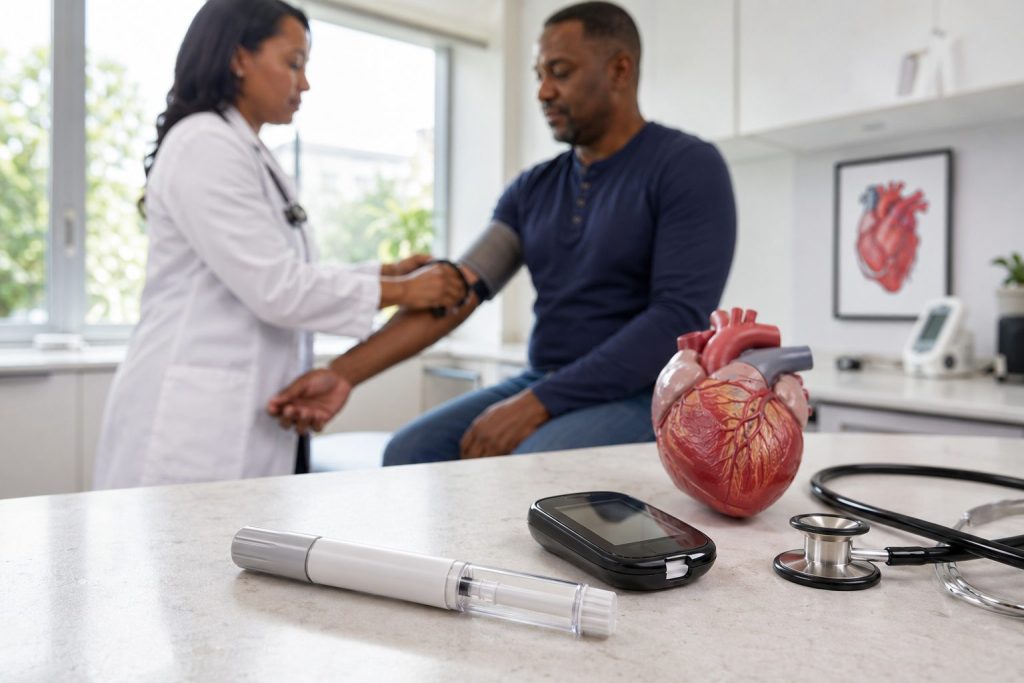
Eli Lilly and Company dropped 0.9% on Friday following the news that Mounjaro received a significant cardiovascular indication. The drop wiped out approximately $9.8…
Eli Lilly · NYSE: LLY · Market data at August 28, 2026, 09:44:26 EDT
| New indication | CV risk reduction in high-risk adults with type 2 diabetes |
| Comparator | Trulicity |
| MACE-3 hazard ratio | 0.92 (95.3% CI: 0.83–1.01) |
| Relative event rate | 8% lower |
| All-cause mortality | 16% lower |
| Statistical result | Noninferior; not superior |
| Product | Q2 2026 sales | Growth |
|---|---|---|
| Mounjaro worldwide | $9.9B | +91% |
| Mounjaro U.S. | $4.8B | +45% |
| Mounjaro ex-U.S. | $5.2B | +172% |
| Zepbound U.S. | $4.9B | +44% |
| Lilly total | $22.97B | Quarter ended June |
Mounjaro as a share of Lilly revenue
43.3%
Mounjaro plus Zepbound as a share of Lilly revenue
64.4%
The label expansion is material because tirzepatide already supplies nearly two-thirds of quarterly revenue.
| Friday open | $1,172.66 |
| Early range | $1,164.32–$1,174.00 |
| 52-week range | $712.05–$1,292.65 |
| P/E ratio | 39.22× |
| Average volume | 2.65M shares |
| Analyst ratings | 18 Buy · 2 Hold · 0 Sell |
Lower realized prices already offset part of U.S. volume growth. Rebate pressure, supply tightness and Novo Nordisk competition can limit incremental revenue. The medicine carries warnings including thyroid C-cell tumors and pancreatitis.
Sources: Lilly, Reuters, PubMed, Lilly Pricing Information and Google Finance. Market data are timestamped above.
Shares of Elastic N.V. rose 17.4% in premarket trade after the company reported its contract backlog expanding more quickly than revenue. The stock climbed…
Fiscal Q1 2027 results and premarket repricing
| Operating measure | Reported | Investor read-through |
|---|---|---|
| Adjusted EPS | $0.70 vs $0.58 consensus | Beat supports the rally |
| Q2 revenue midpoint | $486.5M vs $483M consensus | Modest upside to expectations |
| >$100K ACV customers | 1,800 vs 1,550 year ago | Enterprise cohort grew 16% |
| Non-GAAP operating margin | 16.2% | Positive adjusted leverage |
| GAAP operating margin | -5.0% | Profit-quality gap remains |
Current RPO grew six points faster than revenue. That expands near-term contracted visibility if deployments and renewals convert as planned.
A slower backlog conversion, rising AI infrastructure costs or stronger cloud competition could expose the gap between adjusted profit and the GAAP loss.
Sources: Elastic fiscal Q1 2027 release; FactSet estimates cited by Investors.com; StockAnalysis premarket quote. Market figures timestamped 28 Aug 2026, 08:03 EDT. Implied value change is an estimate, not a reported company figure.
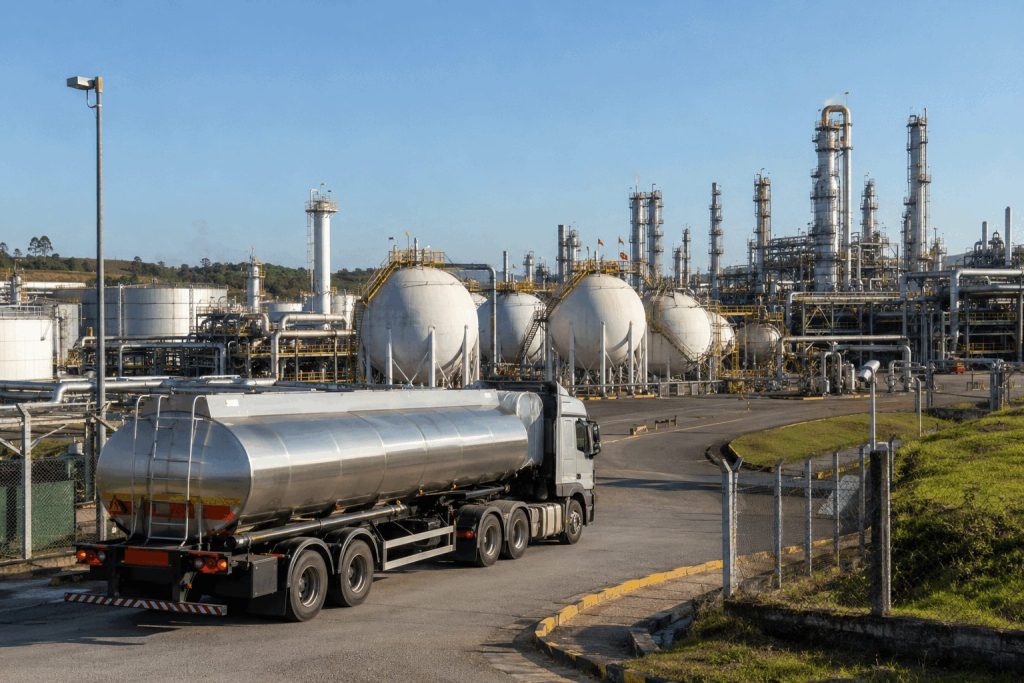
Braskem S.A. ADRs surged 10.8% to hit $1.64 on Thursday. Trading volume soared to 8.04 million shares, significantly higher than the 2.51 million share…
A large supplier-credit headline against a much larger debt problem.
The Petrobras line supports feedstock purchases; it is not a balance-sheet recapitalization.
| Signal | Reading | Investor interpretation |
|---|---|---|
| Market capitalization | ~$283M | Thin equity cushion |
| Enterprise value | ~$12.24B | Debt dominates valuation |
| Trailing net income | −$978M | Equity cannot absorb prolonged losses |
| Operating margin | 0.76% | Little room for feedstock or spread shocks |
| 52-week position | $1.64 vs $1.40–$5.39 | Relief rally near the low |
| Analyst posture | JPM Neutral; Citi Sell; BofA Underperform | Caution predates the new facility |
Petrobras lifted the supplier-credit ceiling by R$2.0 billion and kept 30-day payment terms through December. That improves feedstock continuity during restructuring.
The rally becomes durable only if operating continuity converts into a viable creditor agreement.
Buyers in the U.S. housing market have gained greater leverage in negotiations, but affordability remains limited. Mortgage rates continue to hover close to their…
Listings greatly exceed active demand, but the monthly payment burden remains near its 2026 high.
Updated Aug. 27, 2026Market/asset/sectorPrincipal and interest only. The rate increase adds about $176 monthly, or $2,112 annually.
| Metric | 2025 | 2026E | 2027E |
|---|---|---|---|
| Total home sales | 4.75M | 4.74M | 4.94M |
| Housing starts | 1.36M | 1.37M | 1.34M |
| 30-year rate, avg. | 6.6% | 6.5% | 6.7% |
| Mortgage originations | $1.96T | $2.17T | $2.29T |
Bullish: A sustained decline in Treasury yields lowers mortgage payments and unlocks sidelined demand without requiring deep discounts.
Bearish: Rates remain near 2026 highs, keeping buyer counts depressed and forcing builders to extend incentives.
Watch: Weekly mortgage rates, price-cut shares, pending sales and builder incentive use.
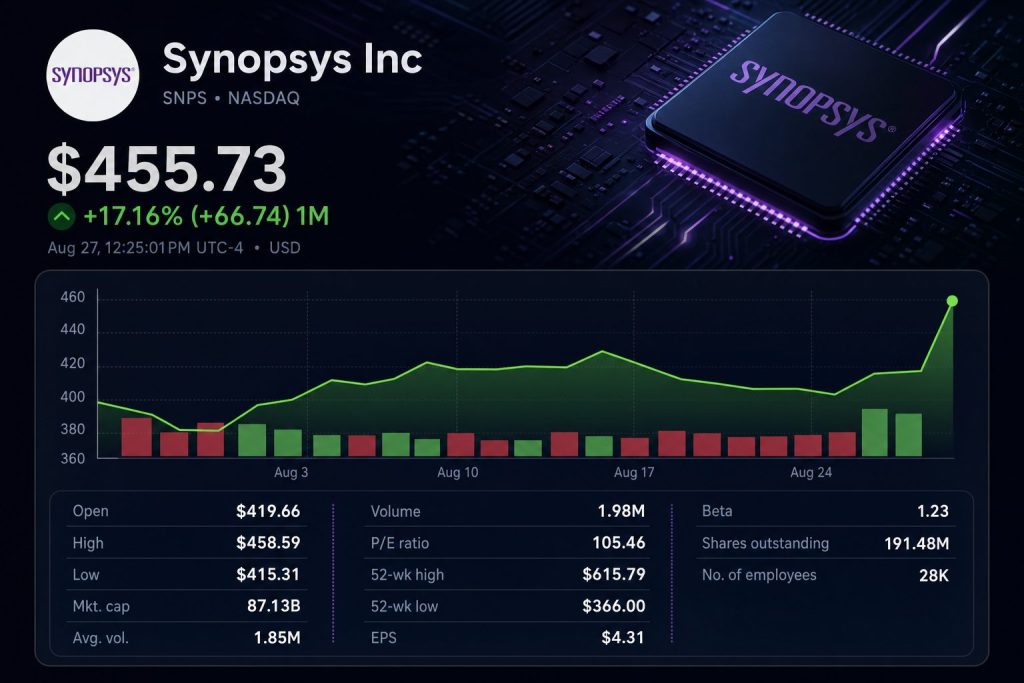
Shares of Synopsys climbed 10.7% as increased demand for chip design enabled the software firm to boost its yearly guidance. The stock was last…
| Measure | FY2026 / Q4 range |
|---|---|
| FY revenue | $9.69B-$9.74B |
| FY adjusted EPS | $15.04-$15.10 |
| Q4 revenue | $2.53B-$2.58B |
| Q4 adjusted EPS | $4.10-$4.16 |
| FY operating cash flow | About $2.8B |
| FY free cash flow | About $2.6B |
| Signal | Current reading | What to watch |
|---|---|---|
| Cash + short-term investments | $3.608B | Integration flexibility |
| Outstanding debt | $10.037B | Debt paydown pace |
| Recurring revenue | 82% | Renewal quality and pricing |
| Q3 operating cash flow | $813M | Conversion into free cash flow |