

Netcapital Shares Rise 31% After Late 10-K Triggers Second Nasdaq Compliance Countdown
Netcapital Inc. stock jumped on Friday, despite the company revealing a second compliance issue with Nasdaq. The stock remained under the exchange's $1 minimum…

All coverage
Netcapital Inc. stock jumped on Friday, despite the company revealing a second compliance issue with Nasdaq. The stock remained under the exchange's $1 minimum…
| Metric | Value | YoY |
|---|---|---|
| Revenue | $0.461M | −47.0% |
| Operating loss | $9.295M | +11.7% |
| Net loss | $9.229M | −67.4% |
| Loss/share | $2.08 | preliminary |
The net loss is about 20× revenue and 2.3× current equity value.
The rally reflects trading demand, not a disclosed improvement in audited fundamentals. The central test is whether the company can complete its audit, meet both Nasdaq timetables and finance operations while the SEC case proceeds.
Netcapital Form 8-K · Nasdaq announcement · Form NT 10-K · Reuters SEC-case report
BURLINGTON, Massachusetts, August 28, 2026, 11:25 – N-able shares jumped 9.1% after the software company announced a $95 million share buyback, an amount representing…
| Cash | $115.8M |
| Total debt | $392.3M |
| Net debt | $276.5M |
| Q2 unlevered FCF | $23M |
| Shares outstanding | 188.9M |
Financial position at June 30, 2026; share count at Aug. 5.
| Metric | Value | Change / margin |
|---|---|---|
| Revenue | $138.2M | +5.9% |
| ARR | $544.5M | +6.0% |
| GAAP gross margin | 76.8% | Core economics |
| Adjusted EBITDA | $39.9M | 28.9% margin |
| GAAP operating income | $16.5M | +76.8% |
| Metric | Range | Midpoint |
|---|---|---|
| ARR | $562M–$565M | $563.5M |
| Revenue | $539M–$542M | $540.5M |
| Adjusted EBITDA | $158M–$161M | $159.5M |
| EBITDA margin | 29%–30% | 29.5% |
Company outlook issued Aug. 10, 2026.
| Company | Ticker | Price | Friday move | Market cap |
|---|---|---|---|---|
| N-able | NABL | $4.31 | +9.11% | $0.82B |
| Qualys | QLYS | $185.35 | −1.72% | $6.49B |
| Tenable | TENB | $37.55 | −0.19% | $4.27B |
| Rapid7 | RPD | $13.37 | −0.96% | $0.91B |
Peer market data around 11:09 EDT on Aug. 28, 2026.
Authorization is optional. The strongest signal would be sustained repurchases funded by recurring cash generation.
Build-A-Bear Workshop, Inc. shares suffered a record 27.3% fall after the retailer cut its annual outlook. The stock closed Thursday at $28.44, its lowest…
| Metric | Q2 2026 | YoY |
|---|---|---|
| Revenue | $115.3M | -7.2% |
| Pre-tax income | $11.6M | -24.1% |
| Pre-tax margin | 10.1% | -220 bps |
| EPS | $0.70 | -25.5% |
| EBITDA margin | 13.2% | -190 bps |
Bars scale the absolute decline against the largest channel drop.
| Cash | $14.0M |
| Cash change YoY | -$25.1M |
| Inventory | $81.1M |
| Revolver borrowings | $0 |
| 1H buybacks + dividends | $22.7M |
| Locations | 674 |
| P/E | 7.1× |
| Dividend yield | 3.16% |
| Analyst coverage | 4 |
| Consensus | Strong Buy |
| Average target | $51.75 |
| Target gap | +82% |
The consensus and targets may not yet reflect Thursday’s guidance cut.
The share-price collapse was larger than the revenue reset because the profit range fell nearly three times as fast. A lower cash balance also reduces flexibility after $22.7 million of first-half capital returns. The next test is whether Halloween assortments stabilize traffic without deeper promotions.
Sources: Build-A-Bear Aug. 27, 2026 Form 8-K and earnings release; Reuters; MarketWatch; StockAnalysis. Figures may be delayed. This dashboard is informational, not investment advice.
Celularity Inc. stock surged over 100% on Thursday, following news of a manufacturing deal that shifted the conversation over the financially challenged cell-therapy firm's…
Potential contract scale meets extreme liquidity and execution risk.
| Measure | USD | Relative scale |
|---|---|---|
| Five-year purchase estimate | >$300M | |
| Closing market value | $60.8M | |
| 2025 revenue | $26.6M | |
| Year-end cash | $6.2M |
The $300M figure is a partner projection, not committed revenue.
Revenue fell 51%; the net loss widened 58%.
Florham Park, New Jersey
9 Grade C + 6 Grade D
projected, not guaranteed
Named products remain unlicensed.
| Signal | Bull case | Risk case |
|---|---|---|
| Commercial conversion | Signed minimum purchases | Forecast remains nonbinding |
| Liquidity | Upfront payments fund scale-up | Equity issuance dilutes holders |
| Manufacturing | Validated lots and release criteria | Qualification delays or batch variability |
| Regulatory | Clear development pathway | No FDA approval for named products |
Sources: Celularity/MuseCell Business Wire release, Aug. 27, 2026; Celularity 2025 Form 10-K; Public/Xignite closing market data. Figures are historical or issuer projections, not investment advice.
Toy Story 5 is set to debut on Disney+ on September 23, following a global theatrical performance that brought in $1.129 billion. This release…
The September 23 streaming debut extends a proven franchise into an SVOD business growing revenue by double digits.
Disney+ streaming launch
Window sequence: theaters → digital storefronts → subscription streaming.
Domestic receipts supplied 42.4% of worldwide gross. The opening accounted for 33.4% of the final domestic total, showing sustained demand beyond launch weekend.
| Metric | Value |
|---|---|
| Price | $106.82 |
| Session move | −2.60% |
| Market capitalization | $186.2B |
| Trailing P/E | 22.1× |
| Volume | 8.70M shares |
Quote timestamp: Aug. 27, 2026, 19:29 EDT. The available data do not attribute the decline to the streaming announcement.
| Fiscal Q3 metric | Result | YoY |
|---|---|---|
| Total revenue | $25.25B | +7% |
| Entertainment revenue | $11.35B | +6% |
| Entertainment operating income | $1.68B | +64% |
| SVOD subscription revenue | — | +15% |
| SVOD advertising revenue | — | +3% |
| Free cash flow | $3.07B | +63% |
Quarter ended June 27, 2026; results reported August 5. Disney reiterated roughly 16% adjusted EPS growth for fiscal 2026 including the 53rd week.
Engagement: whether a theatrical winner raises viewing and lowers Disney+ churn.
Margin: incremental use of an owned film library should support the 13% SVOD margin if marketing stays disciplined.
Window trade-off: subscription availability follows digital sales by 36 days and may curb later purchase revenue.
Disclosure gap: Disney has not published a title-level subscriber or retention target. Current Street consensus is omitted because no live figure was independently verified.
Sources: Disney fiscal Q3 shareholder letter · The Numbers · release announcement coverage · Google Finance. Market figures timestamped Aug. 27, 2026, 19:29 EDT.
PLEASANTON, California, August 27, 2026, 17:30 – Workday shares fell 7.0% in after-hours trading after the company issued a subscription revenue outlook of $2.52…
Market snapshot: August 27, 2026, 17:30 EDT · Quarter ended July 31
Bar lengths are normalized within each comparison, not a common scale.
| Metric | Current | Investor signal |
|---|---|---|
| Q3 subscription revenue | ~$2.515B | Broadly in line |
| FY subscription revenue | $9.94–$9.95B | Tiny midpoint raise |
| New buyback authorization | $4.0B | ~9% of AH value |
| After-hours value loss | ~$3.3B | 7.02% move |
| Consensus | Outperform |
| Analysts | 41 |
| Average target | $188.21 |
| Median target | $202.00 |
| Target range | $92–$275 |
| Upside to average | 4.6% |
Watch enterprise IT budgets, large-deal timing, AI pricing, Financials adoption and acquisition speculation. Extended-hours liquidity can amplify the move.
Autodesk Inc. shares dropped 5.0% in extended trading as investors focused more on the expense of growth rather than a robust quarter.
MaintainX raises reported sales guidance, while financing and transaction costs reduce near-term cash conversion.
| Metric | May | August | Change |
|---|---|---|---|
| FY revenue midpoint | $8.185B | $8.320B | +$135M |
| FY FCF midpoint | $2.763B | $2.738B | −$25M |
| Non-GAAP margin | ~39% | ~39% | Flat |
| FY adjusted EPS | $12.53 | $12.56 | +$0.03 |
| AECO revenue | $1.029B | +17% |
| AutoCAD family | $500M | +14% |
| Manufacturing | $385M | +15% |
| Current RPO | $5.245B | +12% |
| Total RPO | $7.433B | +2% |
| Unbilled deferred revenue | $3.175B | −8% |
| Buy ratings | 30 |
| Sell ratings | 0 |
| Regular-session volume | 3.71M |
| Market value at close | about $57.1B |
Sources: Autodesk fiscal Q2 release; Yahoo Finance; Public after-hours data; Investing.com analyst compilation. Extended-hours prices can be volatile and less liquid.
CAMBRIDGE, Mass., Aug. 27, 2026, 3:16 p.m. EDT — Shares of Sarepta Therapeutics rose 12.9% to $21.98 on Thursday, trading near the session high…
| Registry field | Before | Aug. 26 update |
|---|---|---|
| Site footprint | Original site set | Baylor College of Medicine added |
| Recruitment | Not yet recruiting | Unchanged |
| Enrollment | 20 | Unchanged |
| Estimated start | Jul. 31, 2026 | Aug. 31, 2026 |
| Primary/final completion | Mar. 31, 2027 | Aug. 31, 2027 |
| Path | Confirmation signal | What would challenge it |
|---|---|---|
| Bull | Recruitment begins; FDA pathway gains clarity; short covering persists | Further trial slippage or weak dosing demand |
| Base | Registry edit stays procedural; shares consolidate into the next data event | Company-specific disclosure changes the evidence set |
| Bear | Delay and safety concerns dominate; squeeze fades | Fast activation plus credible label-expansion progress |
Take-Two Interactive Software stock declined 2.12% while Rockstar Games initiated its last marketing campaign for Grand Theft Auto VI.
| Metric | Latest | Signal |
|---|---|---|
| Q1 FY2027 bookings | $1.39B | −3% year on year; slightly above guidance |
| Recurrent consumer spending | 84% of bookings | −1% year on year |
| FY2026 bookings | $6.72B | Baseline before GTA VI launch year |
| GTA V installed base | >230M units | Proof of franchise durability |
| GTA VI pre-orders | “Unprecedented” | Management description; not yet recognized sales |
Search attention and the showcase are strong. The stock still fell 2.12%, suggesting investors want execution evidence, not another anticipation cycle.
At $228.50, the market discounts roughly 30% upside to the analyst target. That spread also embeds delay, launch-quality and mobile-performance risk.
Mercer International's 60% premarket surge disappeared after Thursday's opening bell. The reversal showed how quickly a US$14 million funding headline met the company's much…
| Q2 / June 30 | Value | Signal |
|---|---|---|
| Revenue | US$460.3M | +1.5% YoY |
| Operating EBITDA | −US$21.0M | Negative |
| Net loss | −US$76.0M | 5.4× aid |
| Cash | US$78.8M | Aid = 17.8% |
| Aggregate liquidity | US$191.7M | Aid = 7.3% |
| Shareholders' deficit | −US$98.0M | Capital risk |
Mercer reports a US$76.0M Q2 loss and says advisers are evaluating financing and liquidity alternatives.
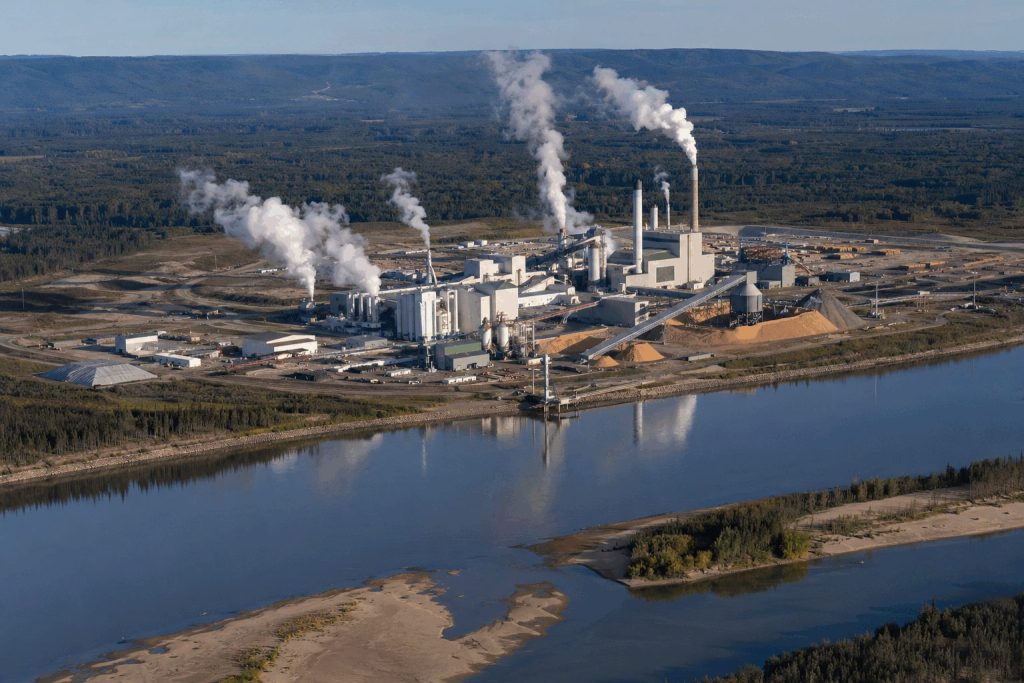
Canada commits C$20M for Peace River modernization; C$19M is repayable from 2031.
Shares briefly reach about 76 cents, an 84% after-hours jump.
Premarket quote holds at 66 cents, up 59.8%.
Regular trades sit near the prior close as volume reaches 56.0M.
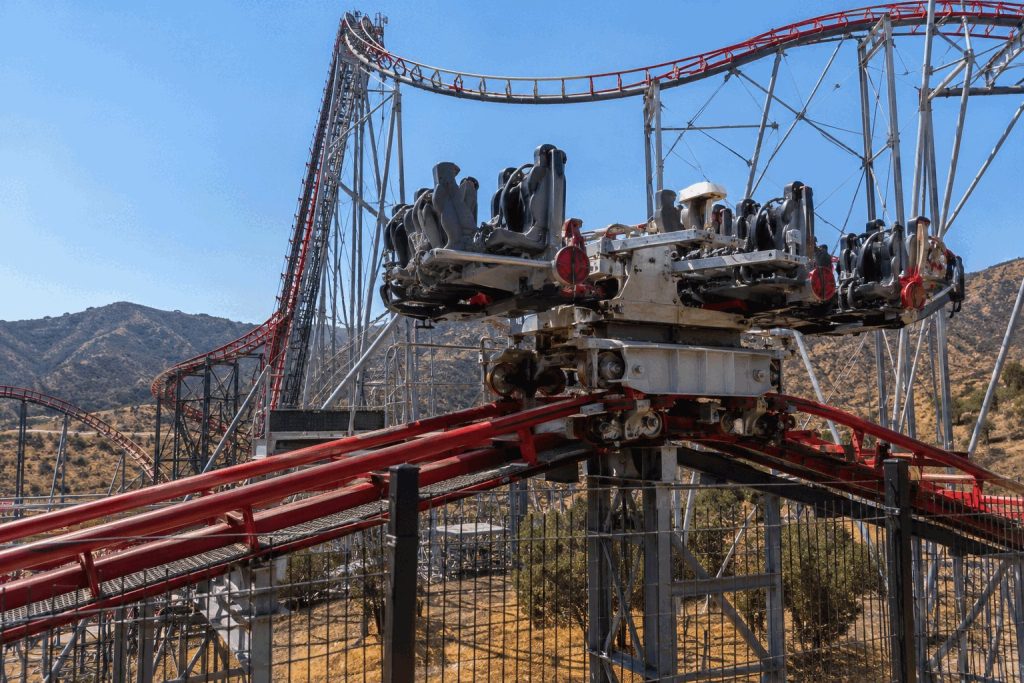
Six Flags Entertainment Corporation is under renewed safety scrutiny after two severe brain hemorrhages were reported in connection with its X2 roller coaster within…
| Q2 measure | Reported | Change |
|---|---|---|
| Revenue | $864.9M | −7.0% |
| Attendance | 13.13M | −7.5% |
| Per-capita spending | $62.89 | +0.7% |
| Operating income | $88.6M | +19.0% |
| Net loss | −$202.6M | Wider |
| Same-park revenue | $864.5M | +2.4% |
| Analyst recommendation | Overweight |
| Average target | $21.71 |
| Coverage | 16 ratings |
| Target upside vs. Aug. 26 close | 34.6% |
| 52-week range | $12.51–$27.37 |
| Short interest | 18.62% of float · Aug. 14 |
| Reopening | A prompt X2 return would contain attendance risk. |
| Inspection | A design finding could raise repair and compliance costs. |
| Claims | Reserve increases would flow directly through earnings. |
| Reputation | Broader safety concern could affect passes and day tickets. |
| Leverage | $5.02B of gross debt reduces tolerance for cash shocks. |
The Wise Origin Bitcoin Fund from Fidelity saw inflows of $25.6 million on August 26, as U.S. spot Bitcoin products marked their eighth consecutive…
Fidelity joined an eighth straight industry inflow session, but FBTC captured less of the latest total than its cumulative flow share.
U.S. dollars, millions. GBTC redemptions offset part of the day’s creations.
The latest flow was 7.9 percentage points below FBTC’s cumulative share of industry net creations.
Bitcoin can move sharply while FBTC is closed, producing opening gaps. A break below Thursday’s $77,658 Bitcoin low would weaken the overnight signal. Fidelity also warns that digital assets can become illiquid; FBTC is not registered under the Investment Company Act of 1940, and shareholders cannot redeem shares for Bitcoin.
Sources: Farside Investors, Fidelity quote, FBTC factsheet, Fidelity disclosures, and Bitcoin market data. Flow observations are for August 26, 2026.
U.S. home prices posted faster gains in June, though the increase continued to trail inflation. The S&P Cotality Case-Shiller national index advanced 1.5% year-on-year,…
June price growth improved, yet inflation stayed faster. The national average also concealed an 8.9-point gap between Chicago and Seattle.
Case-Shiller annual change, June 2026. The zero line separates appreciation from decline.
The indices cover different mortgage and property populations. Their direction matters more than a point-for-point comparison.
Prices rose in 46 states plus Washington, D.C., and in 76 of the 100 largest metropolitan areas.
Case-Shiller is two months behind current conditions. Detroit’s June observation was unavailable because of Wayne County recording delays. Revisions, a rate move or a sharp inventory shift could change the apparent path before the next release.
Sources: S&P Cotality Case-Shiller, Federal Housing Finance Agency, NerdWallet mortgage rates, and Reuters/U.S. Census Bureau. Mortgage payment is principal and interest only; calculation uses 360 monthly payments.
Revolution Medicines has debuted its first commercial product in the U.S. following the launch of RASONQUE. The pancreatic cancer pill, taken once daily, is…
| Item | Current fact |
|---|---|
| Brand / drug | RASONQUE / daraxonrasib |
| Dose | 300 mg oral tablet once daily |
| U.S. status | Approved and available |
| Label | Metastatic pancreatic adenocarcinoma after prior systemic therapy, or when multiagent therapy is unsuitable |
| Diagnostic | No companion test required |
| International | EMA phased review; not approved outside the U.S. |
| Measure | RASONQUE | Chemotherapy | Investor read |
|---|---|---|---|
| Median overall survival | 13.2 months | 6.7 months | 60% lower death risk; HR 0.40 |
| Progression-free survival | 7.2 months | 3.6 months | Roughly doubled; HR 0.49 |
| Objective response rate | 30% | 11% | 19-point advantage |
| Trial size | 500 adults, randomized 1:1 | FDA approved 6.5 months early | |
| June 30, 2026 | Amount | Signal |
|---|---|---|
| Cash and investments | $3.94B | Launch and pipeline runway |
| Q2 research spending | $394.9M | Up from $224.1M |
| Q2 general costs | $110.2M | Commercial buildout lifted costs |
| Q2 net loss | $644.4M | Includes $151M warrant revaluation |
| FY2026 operating-cost guide | $2.1B–$2.2B | Execution remains capital intensive |
Public.com consensus checked Aug. 27, 2026. RBC kept Outperform after approval.
| Driver | Bull case | Pressure point |
|---|---|---|
| Access | Rapid payer coverage and early-access conversion | Prior authorization or reimbursement delays |
| Demand | Broad label without companion testing | Small eligible treated population or discontinuation |
| Net price | Limited discounting supports revenue per patient | Assistance and rebates widen gross-to-net gap |
| Safety | Oral regimen proves easier than chemotherapy | Skin toxicity, diarrhea, ILD or gastrointestinal events |
| Pipeline | Earlier-line and lung-cancer studies expand use | Trial setbacks leave valuation concentrated in one asset |
Abercrombie & Fitch Co. stock soared 35.67% on Wednesday following record-breaking quarterly revenue and an improved forecast. The closing level increased market capitalization by…
| Measure | Latest | Prior / reference | Change |
|---|---|---|---|
| Q2 net sales | $1.267B | $1.209B | +5% |
| Q2 diluted EPS | $4.17 | $1.99 consensus | +109.5% |
| Estimated ex-refund EPS | $2.42 | $1.99 consensus | +21.6% |
| Operating margin | 19.9% | 13.9% prior adjusted | +600 bps |
| FY EPS midpoint | $13.35 | $10.60 prior | +25.9% |
| FY sales growth | ~5% | 3%–5% | Top of old range |
Average-target upside: 2.58%. Consensus: Buy, 14 analysts. Guide-based P/E: 11.1×.
Abercrombie revenue grew 8% and comps rose 4%. Hollister revenue grew 2%, but comps fell 3%.
| Cash and equivalents | $627.7M |
| Half-year operating cash flow | $313.4M |
| Q2 repurchases | $177M |
| FY repurchase plan | At least $500M |
| Remaining authorization | $568M |
The $1.73 billion one-day valuation gain was 17.3 times the $100 million Q2 tariff refund and 6.8 times quarterly operating income. The market therefore priced a broader earnings reset: estimated ex-refund EPS still exceeded consensus, brand sales grew, guidance rose and management expanded buybacks.
Refunds supplied 790 basis points of Q2 margin. Hollister comps remained negative. EMEA comps fell 4%. At $147.75, the stock already sits within 2.6% of the average analyst target.
Sources: Abercrombie & Fitch Co. Aug. 26 earnings release and SEC exhibit; Reuters/LSEG; S&P Global Market Intelligence via StockAnalysis; Yahoo Finance closing quote and volume. Quoted value added is an estimate using the closing market capitalization and price. All market figures are timestamped to the Aug. 26, 2026 U.S. close unless noted.
Shares in The Wendy’s Company dropped after Reuters disclosed that Trian Fund Management, led by Nelson Peltz, does not presently intend to make an…
| Metric | Result | Year over year |
|---|---|---|
| Revenue | $570.6M | +1.7% |
| U.S. same-restaurant sales | — | −7.0% |
| U.S. systemwide sales | $2.88B | −8.2% |
| U.S. restaurant margin | 13.8% | −240 bps |
| Operating profit | $79.3M | −24.0% |
| Net income | $32.6M | −40.8% |
| H1 free cash flow | $120.3M | +9.9% |
FactSet current estimates on Aug. 26. One month earlier: $0.14, $0.57 and $0.64, respectively.
| Company | P/E | Consensus |
|---|---|---|
| Wendy’s | 13.7x | Hold |
| Restaurant Brands | 21.4x | Buy |
| Yum! Brands | 19.5x | Buy |