Mateusz Kaczmarek is a financial and technology journalist at TechStock² covering semiconductors, AI infrastructure, major technology shares and global market developments. He graduated from the Poznań University of Economics and Business and previously worked in financial analysis. Follow him on Google News.
DEARBORN, Michigan, August 31, 2026, 09:36 — Ford shares slipped 0.5% on Tuesday as the automaker reported adjusted earnings of $2.5 billion, offset by…
·3 min read
FORD MOTOR COMPANY · NYSE: F
Profit quality, not the headline loss
Investor dashboard · Market data through August 31, 2026, 09:36 EDT · Financials through Q2 2026
Key funding source for investment and the regular dividend.
Valuation and financial signals
FY2026 EPS estimate
$1.85
Price / estimated EPS
7.5×
Dividend yield
4.32%
Cash and securities
$31.6B
Company debt, ex-Credit
$23.6B
Friday volume / 65-day average
75%
Investor bridge
Ford’s adjusted EBIT rose 17% even as revenue fell 4%. Blue pricing and a smaller Model e loss did the heavy lifting, while Ford Pro slipped. The $1.33 billion GAAP loss chiefly reflects strategic reversals already captured in $4.18 billion of special items. The shares trade at about 7.5 times estimated 2026 earnings, but the discount will persist unless cash conversion and Pro margins recover.
Watch: Pro marginWatch: Model e lossWatch: warranty costsWatch: tariffs
Risk monitor
Tariffs, pricing pressure, warranty expense and supply disruption can erase the margin gain. More EV cancellations could trigger further charges. Higher delinquencies or used-vehicle weakness would pressure Ford Credit.
Plug Power shares fell 3.52% on Friday as rising Treasury yields pressured rate-sensitive clean-energy stocks. The stock closed at $2.19 on 46.6 million shares.
·2 min read
NASDAQ: PLUG
Plug Power
Market data: Aug. 28, 2026 close, ET Financial data: quarter ended June 30, 2026
Friday close
$2.19
-3.52%
Volume
46.6M
81% of 3-month average
Market value
$3.06B
Loss-making equity
Analyst target
$3.49
Hold consensus
Cash runway bridge
Quarterly net cash use equaled about 38% of unrestricted quarter-end cash. Asset transactions are expected to add $80 million.
Operating reset
Metric
Q2 2026
Change
Revenue
$178M
+9% sequential
Gross margin
Near 0%
From -31% YoY
Operating expense
$62M
-50% YoY
GAAP EPS
-$0.14
From -$0.20
Net cash use
$61M
-58% sequential
Commercial signals
GenDrive deployments
1,666
+125% YoY
Service revenue
$30M
+82% YoY
Service margin
+27%
Positive
Fuel revenue
$39M
+15% YoY
Fuel gross margin
-48%
Still the drag
What must happen next
Management targets 15%–16% revenue growth and positive Q4 EBITDAS. The market’s harder test is sustained cash generation.
Average analyst target implies roughly 59% upside, but estimates span $0.75 to $7.00.
Pfizer Inc. edged down 0.2% on Friday, closing at $27.96. The modest change belies a more pronounced battle between expanding sales from key drugs…
·2 min read
Pfizer investor dashboard
NYSE: PFE · core growth versus the COVID reset
Market: Aug. 31, 2026 · 05:02 EDT
Share price
$27.96
-0.21% Friday
Market value
$159.3bn
36.8× trailing P/E
Q2 revenue
$15.0bn
+3% reported
Adjusted EPS
$0.77
$2.80–$3.00 FY guide
Revenue reset
Core ex-COVID
+5%
Launched/acquired
+18%
Total operational
+1%
COVID outlook
-$1bn
Valuation context
Company
P/E
Move
Pfizer
36.8×
-0.2%
J&J
31.1×
+0.8%
Merck
118.7×
-0.8%
Eli Lilly
39.4×
-0.2%
Pfizer trades near 9.6× the midpoint of adjusted 2026 EPS guidance. The trailing multiple is distorted by impairments.
Capital allocation
First-half dividends
$4.9bn
Internal R&D
$5.3bn
2026 buybacks
$0
Indicated yield
6.15%
Cost savings by end-2026
$5.7bn
Investor test
Core products must outrun a roughly $4 billion COVID franchise. Patent losses, pricing pressure and integration charges can absorb the benefit of launched-product growth.
Sources: Pfizer Q2 2026 release and investor relations; market data timestamped above. Guidance and non-GAAP measures are management figures.
Amazon.com rose roughly 4% on Friday following an analyst upgrade that emphasized the possibilities for agentic AI to enhance retail operations. Shares were around…
·3 min read
NASDAQ: AMZN · STOCK MOVE
AWS growth versus the AI spending bill
Market data: August 31, 2026, 04:37 EDT Financials: Q2 2026
Share price
$266.43
+3.95%
Market value
$2.90T
About $110B added
AWS growth
37%
Fastest in 18 quarters
2026 capex plan
~$220B
Up $20B from prior plan
Operating engine
AWS generated 60% of group operating profit from 21% of sales.
Q2 scorecard
Group sales
$200.6B
Operating income
$27.5B
AWS sales
$42.2B
AWS operating income
$16.6B
AWS operating margin
39.3%
Advertising growth
26%
Cash-flow bridge
Measure
Current TTM
Prior TTM
Operating cash flow
$161.4B
$121.1B
Free cash flow
−$7.6B
$18.2B
P&E purchase increase
+$66.1B year over year
Implied annualized Q2 operating profit
$110.0B
Market value / annualized operating profit
~26×
Investor watch
Capacity
Two million additional NVIDIA GPUs through early 2029.
Returns
AWS margin must fund power, chips and depreciation.
Retail
Agentic AI and robotics must improve cost per unit.
Core test: keep AWS near 37% growth without making negative free cash flow structural.
Sources: Amazon Q2 2026 results; current market quotes; public reporting on the AWS–NVIDIA expansion. Estimates may differ from reported GAAP measures.
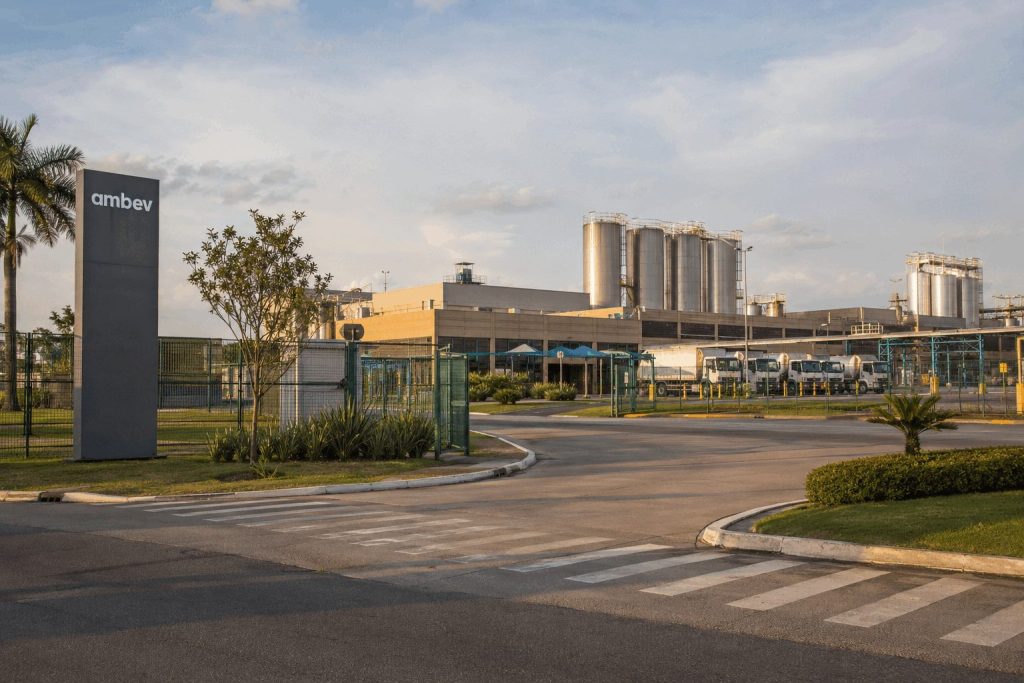
Ambev S.A. declined 0.69% on Friday. Trading volume was 30.16 million American depositary shares, approximately 7% above the stock’s usual average. The drop cut…
·3 min read
NYSE: ABEV · STOCK MOVE · Yahoo Most Active #20
Ambev: margin recovery meets cautious positioning
Market: Aug. 28, 2026, 16:00 EDT Prepared: Aug. 30, 2026, 23:12 BRT
Friday close
$2.86
−0.69% · −$0.02
Trading volume
30.16M
1.07× recent average
Market value
$45.0B
≈$310M erased
Valuation
14.6×
Trailing P/E · 7.9× EV/EBITDA
Price context
The ADR is 17.1% below its 52-week high and 36.2% above its low.
2Q26 operating bridge
Metric
Result
YoY
Volume
39.73M hl
+1.4%
Net revenue
R$20.15B
+6.1%
Normalized EBITDA
R$6.38B
+8.9%
Normalized profit
R$3.49B
+23.3%
Operating cash flow
R$4.71B
+54.5%
EBITDA margin
31.6%
+80 bps organic
Brazil Beer
+5.0%
Volume · EBITDA +12.8%
Digital growth
+58%
BEES Marketplace GMV
Shareholder yield
4.23%
Trailing dividend · $3.28 target
Analyst stance
Rating
Count
Share
Buy
3
17%
Neutral
10
56%
Sell
5
28%
18 firms listed by Ambev. The $3.28 published average target implies about 15% upside.
What moves the thesis
Bull case: Premium volumes and digital ordering sustain revenue growth above costs.
Bear case: Brazil demand fades while FX and commodities push cash cost per hectoliter toward the top of the 4.5%–7.5% guide.
Next confirmed cash catalyst: R$1.9B interest-on-capital tranche scheduled for Oct. 6, 2026.
Investor bridge
Friday's routine decline contrasts with accelerating operating cash flow and a recovered 31.6% EBITDA margin. The stock's 14.6× earnings multiple and 4.2% yield look defensive, but the 3 Buy / 10 Neutral / 5 Sell split shows that investors still need proof World Cup-linked volume and premiumization can persist.
Sources: Ambev 2Q26 release and analyst coverage; Yahoo Finance Most Active; Finviz market data; UOL/DataWise+ B3 activity ranking. Figures are time-stamped above.
PORTLAND, Oregon, August 30, 2026, 17:00 – Shares of NuScale Power fell 4.6% as markets reacted to the contrast between the company's $4 billion…
·3 min read
NYSE: SMR · STOCK MOVE
NuScale: liquidity versus commercialization
Market: Aug. 28, 2026, 16:00 EDT Financials: Q2 ended June 30, 2026
Friday close
$9.29
−4.62%
Volume
37.8M
112% of 65-day average
Market value
$3.99B
≈$190M erased Friday
Short float
16.9%
67.83M shares
Valuation bridge
Equity value
$3.99B
Cash + investments
$1.90B
TTM net loss
$416M
TTM revenue
$10.7M
Product scale
Peer tape
Company
Friday
Market value
Signal
NuScale
−4.62%
$3.99B
Approved design, pre-commercial
Oklo
−5.64%
$7.07B
Advanced-reactor developer
Nano Nuclear
−6.60%
$0.94B
Microreactor developer
Cameco
−5.94%
$43.47B
Operating fuel supplier
Investor bridge
Cash and investments equal 48% of market value, but the stock still trades near 373 times trailing revenue. Binding customer orders must convert regulatory progress into cash flow.
Next catalyst and risks
Q3 results are scheduled for November 5. Watch TVA and Romanian contract progress, partner financing, quarterly cash use, construction costs and potential dilution.
Sources: NuScale Q2 2026 results; Google Finance and StockAnalysis market data; Barron's analyst data; Reuters macro reporting. Historical figures, not investment advice.
PayPal Holdings lost 12.71% on Friday after Advent International and Stripe abandoned their takeover pursuit. The shares closed at $53.66 on 36.34 million shares.
·2 min read
PYPL
NASDAQ: PYPL · Stock move
PayPal Holdings
Deal premium vanished. The standalone margin bridge is back.
Market data: Aug. 28, 2026, 16:00 EDT Dashboard: Aug. 30, 2026, 10:38 EDT
Friday close
$53.66
Range: $50.14–$54.76
Daily move
−12.71%
Previous close: $61.47
Volume
36.34M
2.28× Yahoo's 15.97M reference
Market value
$47.3B
About $6.9B erased Friday
Deal price, market price and analyst reference
The displayed analyst average and abandoned bid sit almost together. Both are roughly 12% above Friday's close.
Valuation reset
Measure
PayPal
Reference
Forward P/E
10.85×
Industry median ~15×
Price / 2026 EPS guide
9.97×
$5.38 adjusted EPS
Offer premium to close
12.7%
$60.50 vs. $53.66
Analyst average upside
12.2%
$60.20 vs. $53.66
Q2 operating bridge
Metric
Result
Signal
Revenue
$8.68B
3% constant-currency growth; $8.47B estimate
Total payment volume
$486.4B
9% constant-currency growth
Adjusted EPS
$1.38
Beat $1.28 estimate
Adjusted operating margin
17.4%
Down 248 basis points
What changes the multiple
Upside
$400M savings targeted by year-end 2026.
2026 adjusted EPS guide of about $5.38 beats prior consensus.
Agentic commerce can use PayPal's consumer and merchant network.
Friday's move did more than remove a takeover premium. It priced PayPal almost exactly at ten times its 2026 adjusted EPS guide. The discount can close if checkout share and margins stabilize. If both keep falling, the industry discount is justified.
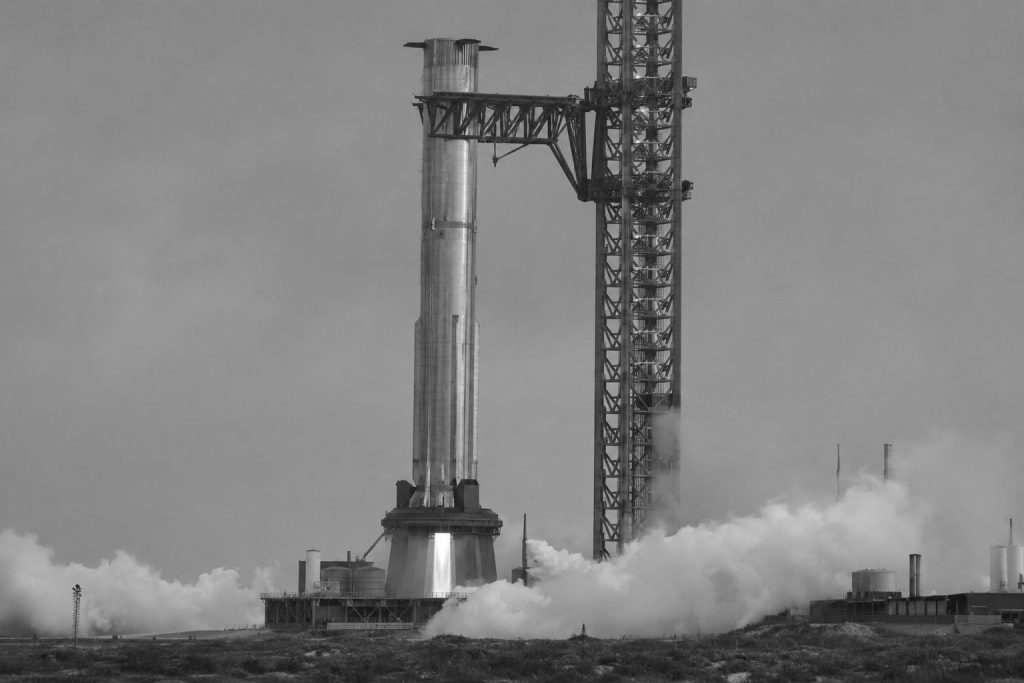
SpaceX has moved Starship Flight 14 into September after completing a full-duration static fire of Booster 21. The schedule shift turns a rocket test…
·2 min read
SpaceX · Nasdaq: SPCX
Starship Flight 14 investor dashboard
Orbital capability is the bridge between experimental hardware and scalable capacity.
Market quote: Aug. 28, 2026 · 20:15 EDT Program status: Aug. 30, 2026 · 04:12 EDT
Last verified quote
$141.50
+0.41% · 55.1M shares
Implied equity value
$1.85T
Post-offering shares × quote
Annualized sales multiple
59.2×
$7.81B Q2 revenue × 4
Flight checklist
6 / 19
NET September 2026
Why Flight 14 matters
Flight 14 combines the first orbital trajectory, a viable payload and a possible Ship 41 tower catch. Success would lower three uncertainties at once: performance, reuse and deployment capacity.
Valuation frame
Q2 revenue$7.81B
Q2 capex>$18B
Cash + securities$100B
Backlog$47.5B
Analyst average target$219.22
Target upside54.9%
Flight 13 versus Flight 14
Test
Flight 13 result
Flight 14 objective
Financial signal
Trajectory
Suborbital
First orbital flight
Broadens commercial launch utility
Payload
Upgraded Starlink deployment
Viable orbital payload
Links vehicle to revenue capacity
Ship recovery
Soft splashdown; later recovered
Possible tower catch
Tests rapid reuse
Booster
Landing-burn failure
V3 Booster 21
Execution risk remains visible
Milestone clock
Done
Booster 21 proof campaign Structural and tank validation.
Done · Aug. 28
33-engine static fire Full booster propulsion test.
Next
Ship 41 campaign Complete testing and pad work.
Pending
Stack + notices + FAA No firm launch date confirmed.
Investor bridge
At about 59 times annualized Q2 revenue, the market assumes Starship becomes more than a development program. Flight 14 can reduce that execution discount by proving orbit, payload delivery and recoverability in one mission.
What changes the view: Ship 41 static fire, vehicle stacking, FAA operational approval and SpaceX launch confirmation.
Tenon Medical’s shares were little changed on Friday, although trading volumes reached nearly 12 times the company’s share count. The unchanged finish came alongside…
·3 min read
Tenon Medical · Capital Structure Monitor
NASDAQ: TNON · Friday close and filings through Aug. 28, 2026
Updated Aug. 29, 2026 · 19:08 EDT
Close$5.00−0.40% · Aug. 28
Volume7.76M5.9× 65-day average
Market cap$3.34M667,050 shares outstanding
Placement$3.0MGross proceeds · $5.02 price
Potential fully expanded share base
28.7%25.7%45.6%
Legacy holders28.7% if all securities convert
Base placement597,610 shares/pre-funded warrants
Warrant overhang1,058,517 shares at $5.02
Q2 operating snapshot
Metric
Q2 2026
YoY
Revenue
$1.28M
+127%
Gross profit
$0.81M
+232%
Gross margin
64%
+21 pts
Operating expenses
$4.2M
+35%
Net loss
$(4.1)M
Wider
Cash · June 30
$1.7M
−55% vs Dec.
Why the financing dominates
Measure
Value
Investor read-through
Gross proceeds / market cap
89.8%
Large relative cash injection
Base securities / current shares
89.6%
Immediate ownership reset
Warrants / current shares
158.7%
Multi-year dilution overhang
Potential warrant cash
$5.31M
Arrives only if exercised
Friday turnover / shares
11.6×
Extreme churn in a thin float
Recent timeline
Jul. 1$4.2M public offering closed; about $3.6M net.
Aug. 10One-for-35 reverse stock split became effective.
Aug. 13Q2 revenue +127%; gross margin reached 64%.
Aug. 24Nasdaq minimum-bid compliance restored.
Aug. 28$3.0M placement priced at $5.02 with five-year warrants.
What to watch
ClosingConfirm settlement and final mix of common shares versus pre-funded warrants.
Debt$5.2M convertible notes mature in September, extendable to December.
ExecutionCase growth must narrow a quarterly loss exceeding three times revenue.
Sources: Tenon Medical releases; MarketWatch/FactSet quote data. Market figures timestamped Aug. 28, 2026, 16:00 EDT unless noted. Scenario math assumes full exercise and excludes other issuance.
MORRIS PLAINS, New Jersey, August 29, 2026, 18:36 – Solstice shares surged 12.8% following the termination of a $14.5 billion deal and the approval…
·3 min read
Solstice Advanced Materials · NASDAQ: SOLS
Deal risk removed, execution risk remains
Market close: August 28, 2026, 16:00 EDT Company data through August 27–28, 2026
Friday close
$63.53
+12.76%
Volume
16.47M
5.2× 65-day average
Market value added
$1.15B
one session
Buyback authorized
$500M
4.9% of market cap
Scale of the repricing
Buyback$0.50B
Value added$1.15B
SOLS market cap$10.13B
Terminated deal$14.5B
The rally exceeded the buyback's mechanical effect. The market added about 2.3 times the authorization, signaling relief over avoided debt, dilution and integration complexity.
Q2 2026 operating bridge
Metric
Result
Net sales
$1.148B · +11%
Net income
$119M · +23%
Adjusted EBITDA
$290M · +2%
Adjusted margin
25.3% · −218 bps
Electronic Materials sales
+15%
Nuclear revenue
+27%
Capital and guidance
First-half free cash flow
$248M
Cash
$750M
Long-term debt
$2.0B
Net leverage
1.3×
2026 sales guidance
$4.125B–$4.185B
2026 EBITDA guidance
$1.035B–$1.055B
Market cap / EBITDA midpoint
9.7×
Decision timeline
July 6
$14.5 billion Element transaction announced.
Aug. 27
Companies terminate the agreement with no fee.
Aug. 27
Board authorizes first $500 million repurchase.
Aug. 28
SOLS closes 12.76% higher; ESI falls 4.38%.
Key watch: whether margin recovery and cash generation support repurchases alongside $420M–$440M of planned 2026 capital spending.
Sources: Solstice Advanced Materials, SEC Form 8-K, Reuters and August 28 market data.
Houston, August 29, 2026, 15:38 – SLB stock gained 4.2% following news of its data arrangement in Venezuela, while analysts' consensus target still indicates…
·3 min read
SLB · NYSE
Venezuela option, narrow valuation gap
Stock move / oilfield services
As of Aug. 28, 2026 16:00 ET close
Close
$57.33
Friday
Daily move
+4.22%
Third straight gain
Consensus target
$61.93
+8.03% implied upside
Q2 revenue
$8.97B
Adj. EPS $0.55
Operating signals
MetricReadingDirection
North America revenue+36% YoYStrong
Latin America revenue+15% YoYStrong
Middle East & Asia revenue$2.57B-14%
Q3 sequential revenue guide+3%–4%Growth
2025 operating cash flow$6.49B18.2% of revenue
Target range vs. $57.33 close
Consensus upside captured
Friday's close leaves a modest 8.03% gap to the average target.
Catalyst map
EventStatusInvestor read
PDVSA data contractStartedNew option
Payment mechanismUndisclosedCollection risk
2027 Venezuela contractsExpectedExecution test
Q4 revenue>$10B target+5% YoY
What matters next
Contract economics must become visible. The bull case needs paid work, stronger Latin American growth and Middle East recovery.
Risk watch: sanctions, in-kind payments, damaged PDVSA data and a renewed Middle East disruption.
Sources: Reuters/LSEG, MarketWatch and MarketScreener. Price and target figures timestamped Aug. 28, 2026, 16:00 ET. Fundamental figures use Q2 2026 or FY2025 reporting periods as labeled.
Plug Power Inc. stock slipped 3.5% on Friday, even after the hydrogen provider posted its first approximately break-even quarterly gross margin in four years.
·3 min read
NASDAQ: PLUG
Plug Power: margin gains, cash test
Market data: Aug. 28, 2026, 16:00 EDT Financials: quarter ended June 30, 2026
Close
$2.19
−3.52% Friday
Volume
46.64M
Yahoo Most Active rank 14
Market cap
$3.06B
About 4.1× trailing sales
Cash coverage
2.7×
Cash ÷ quarterly net use
Operating reset
Gross margin
−0.9%
Q1 margin
−13%
Year-ago margin
−31%
improvingnegative margin
Measure
Q2 2026
Change
Revenue
~$178M
+9% q/q
Operating expenses
~$62M
−50% y/y
Net cash usage
~$61M
−58% q/q
Unrestricted cash
~$162M
quarter end
Segment signal
Business
Revenue
Gross margin
Service
~$30M
+27%
Fuel
~$39M
−48%
Service economics turned positive. Fuel losses remain the largest visible drag.
1,666 GenDrive units were deployed, up 125% year over year. Two major customers plan more than 20,000 refreshes over three years.
What the price implies
Indicator
Current reading
Investor interpretation
2026 revenue-growth guide
15%–16%
Growth accelerated enough for management to raise guidance.
Friday's close sits 52% below the high and 55% above the low.
Sources: Plug Power Q2 2026 release; StockAnalysis market data; MarketScreener analyst consensus. Multiples and cash coverage are calculations from disclosed figures. Market data timestamp: Aug. 28, 2026, 16:00 EDT. Financial data reported Aug. 10, 2026.
Intel Corporation dropped 2.85% on Friday, topping Yahoo Finance’s most-active stocks. Shares finished at $89.47, having reached an intraday peak of $92.21.
·2 min read
NASDAQ: INTC · offering discount
Intel: growth meets dilution
Market close: Aug. 28, 2026 · 16:00 EDT Dashboard checked: Aug. 29, 2026 · 09:04 EDT
Close
$89.47
▼ 2.85% Friday
Volume
86.17M
≈ $7.7B turnover
Offer discount
−5.8%
$95 issue price
Net proceeds
$19.7B
≈ 122% of Q2 revenue
Price versus new-share issue
The market has erased the offering premium. New capital strengthens liquidity, but every project now carries a higher per-share return hurdle.
Capital math
New shares
210.53M
Estimated dilution
≈4.1%
Q2 capex
$2.65B
Proceeds / Q2 capex
7.4×
Est. equity value
≈$476B
Dilution and equity value use an estimated post-offering share count derived from Q2 diluted shares and the announced issuance.
Operating dashboard
Measure
Latest
YoY / guide
Signal
Q2 revenue
$16.1B
+25%
Strong
Data Center & AI
$6.3B
+59%
AI demand
Intel Foundry*
$5.8B
+31%
Includes internal sales
GAAP operating margin
11.1%
+35.8 pts
Major recovery
Operating cash flow
$7.0B
vs. $2.05B
Investment support
Q3 revenue guide
$15.8B–$16.8B
Midpoint +1% QoQ
Slower sequential pace
Implied valuation
≈59×
Price / annualized Q3 non-GAAP EPS guide
≈7.3×
Estimated equity value / annualized Q3 revenue midpoint
These are simple run-rate estimates, not consensus forecasts.
Friday semiconductor tape
Security
Move
Read-through
Marvell (MRVL)
−10.3%
Earnings and margin reset
Nvidia (NVDA)
−4.6%
Broad AI-hardware pressure
Intel (INTC)
−2.85%
Below offering price
Nasdaq Composite
−0.52%
Technology risk-off
S&P 500
−0.25%
Broad market decline
What investors are testing: Intel’s 25% revenue growth and 59% Data Center & AI growth now compete with roughly 4% dilution and heavy foundry investment. A sustained move above $95 would signal confidence that the new capital can earn attractive returns.
Risk watch: Better yields and AI demand could push results above guidance. Execution delays, weaker pricing or lower external foundry utilization could keep the shares below the issue price.
DraftKings Inc. shares climbed 4.23% on Friday after the NFL renewed its official sportsbook partnership. The stock closed at $25.26 on 19.82 million shares.
·2 min read
COMPANY · PRODUCT/COMMERCIAL CATALYST
DraftKings: NFL renewal meets a margin test
League access is preserved. Fanatics raises the customer-acquisition stakes.
Market data: Aug. 28, 2026, 16:15 EDT Financials: quarter ended June 30, 2026
DKNG close$25.26+4.23%
Trading volume19.82mshares
Equity value$22.47bn≈$0.91bn added
FY26 guidance$6.5–6.9bnrevenue
Partnership economics
2025 NFL legal wagers
$30bn
Q2 sports volume
$13.1bn
FY26 EBITDA guide
$0.7–0.9bn
NFL deal value was not disclosed. Bars compare scale, not identical accounting measures.
Q2 operating signals
Metric
Result
YoY
Revenue
$1.443bn
−4.6%
Sports volume
$13.1bn
+15%
Monthly unique payers
3.6m
+9%
Revenue per payer
$132
−13%
Adjusted EBITDA
$114.6m
−61.9%
Public-operator tape
Company
Price
Day
Volume
New NFL role
DraftKings (NASDAQ: DKNG)
$25.26
+4.23%
19.82m
Sportsbook + DFS
Flutter/FanDuel (NYSE: FLUT)
$101.78
+7.12%
3.01m
Sportsbook
PENN Entertainment (NASDAQ: PENN)
$17.36
+0.12%
2.18m
None
What the renewal preserves
Multi-year official sportsbook status; NFL trademarks and official data; integrations across league digital properties; event presence; continued official daily-fantasy status.
Investor watchlist
Margin: contract pricing is undisclosed. Competition: Fanatics joins DraftKings and FanDuel. Hold: bettor-friendly outcomes can cut revenue quickly. Policy: taxes and regulation remain state-specific.
Read-through
The stock's 4.2% gain treats NFL continuity as valuable, but the business test is sharper: convert football visibility into payer growth while reversing the 13% decline in revenue per payer. A stable promotional ratio and improving sportsbook hold would strengthen the bridge from the renewal to DraftKings' $700–$900 million Adjusted EBITDA target.
Sources: NFL partnership announcement; Reuters, Aug. 27; DraftKings Q2 results; Google Finance. Figures are historical or management guidance, not investment advice.
NEW YORK, August 28, 2026, 15:20 – Shares of Fangdd rose sharply by 51.9% as the company managed to trim its losses through cost-cutting…
·3 min read
NASDAQ: DUO · Investor dashboard
Fangdd: cost cuts ignite a 51.9% rally
Market snapshot: August 28, 2026, 14:58:59 EDT Financial period: six months ended June 30, 2026
Share price
$1.06
+$0.362 · +51.86% intraday
Volume
54.37m
1.41× weighted-average shares
Implied market cap
$40.9m
About $14.0m added Friday
Intraday range
$0.619–$1.15
85.7% low-to-high spread
What improved—and what did not
Revenue
−43.1%
Closed-loop GMV
−30.8%
Gross margin
+410bp
Operating costs
−54.3%
Operating loss
−63.9%
The market rewarded a faster cost reset than revenue decline. The operating improvement is real, but it came while the transaction base contracted.
Price-action read
low14:58 pricehigh
Open: $0.676 · Prior close: $0.698. The stock traded above the prior close after opening below it.
First-half scorecard
Metric
H1 2025
H1 2026
Change
Revenue
RMB203.4m
RMB115.7m
−43.1%
Closed-loop GMV
RMB8.0bn
RMB5.5bn
−30.8%
Gross profit
RMB18.5m
RMB15.3m
−17.1%
Gross margin
9.1%
13.2%
+410bp
Operating expenses
RMB90.2m
RMB41.2m
−54.3%
Net loss
RMB39.2m
RMB34.5m
−12.0%
Liquidity and valuation
Cash + restricted cash + investments
RMB107.2m
Six-month operating cash use
RMB36.7m
Liquidity / six-month cash use
2.92×
Current liabilities
RMB177.6m
Market cap / H1 revenue
2.39×
Market cap / annualized H1 revenue
1.20×
Market capitalization uses $1.06 and 38.55 million weighted-average shares. Multiples are arithmetic indicators, not analyst estimates.
Investor bridge
The core debate: Fangdd removed RMB49.0 million of operating expense while revenue fell RMB87.6 million. That narrowed the operating loss by RMB45.8 million, but cash use and property-market exposure remain.
Weighted-average ordinary shares rose from 3.01 million to 38.55 million year over year.
That expansion dilutes each legacy share’s claim on any operating recovery. It also makes per-share comparisons less informative without a share-count adjustment.
Catalyst timeline and next checks
08:30 EDTFangdd released unaudited first-half results.14:58 EDTShares stood at $1.06, up 51.86%, on 54.37 million volume.Next filingWatch for cash movement, any financing and the next foreign-issuer filing.Nasdaq riskThe July minimum-bid notice makes sustained compliance a material checkpoint.Operating proofInvestors need stable GMV, durable double-digit gross margin and lower cash use.
Sources: Fangdd first-half 2026 release; Fangdd investor relations; Google Finance; MarketWatch; StockAnalysis. Market figures timestamped above. Company figures are unaudited and translated at RMB6.7851 per U.S. dollar.