NEW YORK, August 25, 2026, 20:00 EDT — The Chinese yuan slipped back from a 3½-year high after the People’s Bank of China set its daily midpoint 633 pips under the spot rate, as the fixing continued to trail market levels.
| Measure | Rate |
|---|---|
| Reuters estimate | 6.7219 |
| PBOC midpoint | 6.7852 |
| Difference | 0.0633 yuan |
| Gap vs estimate | 0.94% |
A higher USD/CNY fixing means a weaker yuan reference. Onshore trading is permitted within 2% of the midpoint.
An unchanged yuan profit base translates into about 6.5% more dollars after a 6.11% yuan appreciation. Hedges can offset the effect.
Dollar-invoiced revenue buys fewer yuan. Local wages and supplier costs stay in yuan, narrowing margins unless pricing or productivity compensates.
| Close | $26.41 |
| Session | +0.61% |
| After hours | $26.44 |
| Volume | 14.1m |
| Assets | $5.30bn |
Reversal: Chinese growth weakness or a stronger dollar can erase translation gains.
Policy: Wider weak-side fixings can deter one-way yuan positions.
Margins: Faster appreciation can hurt unhedged exporters before reported translation improves.
| Metric | Reading | Period |
|---|---|---|
| Total revenue | $1.22B | Q2 2026 |
| Subscription & services | $555M | Q2 2026 |
| Share of net revenue | 48% | Q2 2026 |
| Adjusted EBITDA | $207.8M | Q2 2026 |
| Net loss | −$359.5M | Q2 2026 |
| Trading-volume share | 10.3% | Q2 2026 |
Interpretation: Base can distribute the assets across wallets and DeFi protocols. The investor case still needs disclosed volume, take rate and contribution margin.
| Company | August 25 close | Day move | Market cap | Forward P/E | Analyst target upside |
|---|---|---|---|---|---|
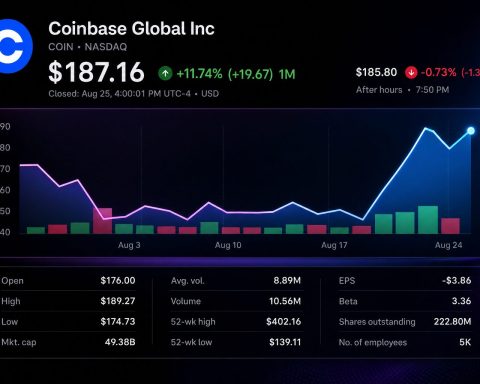
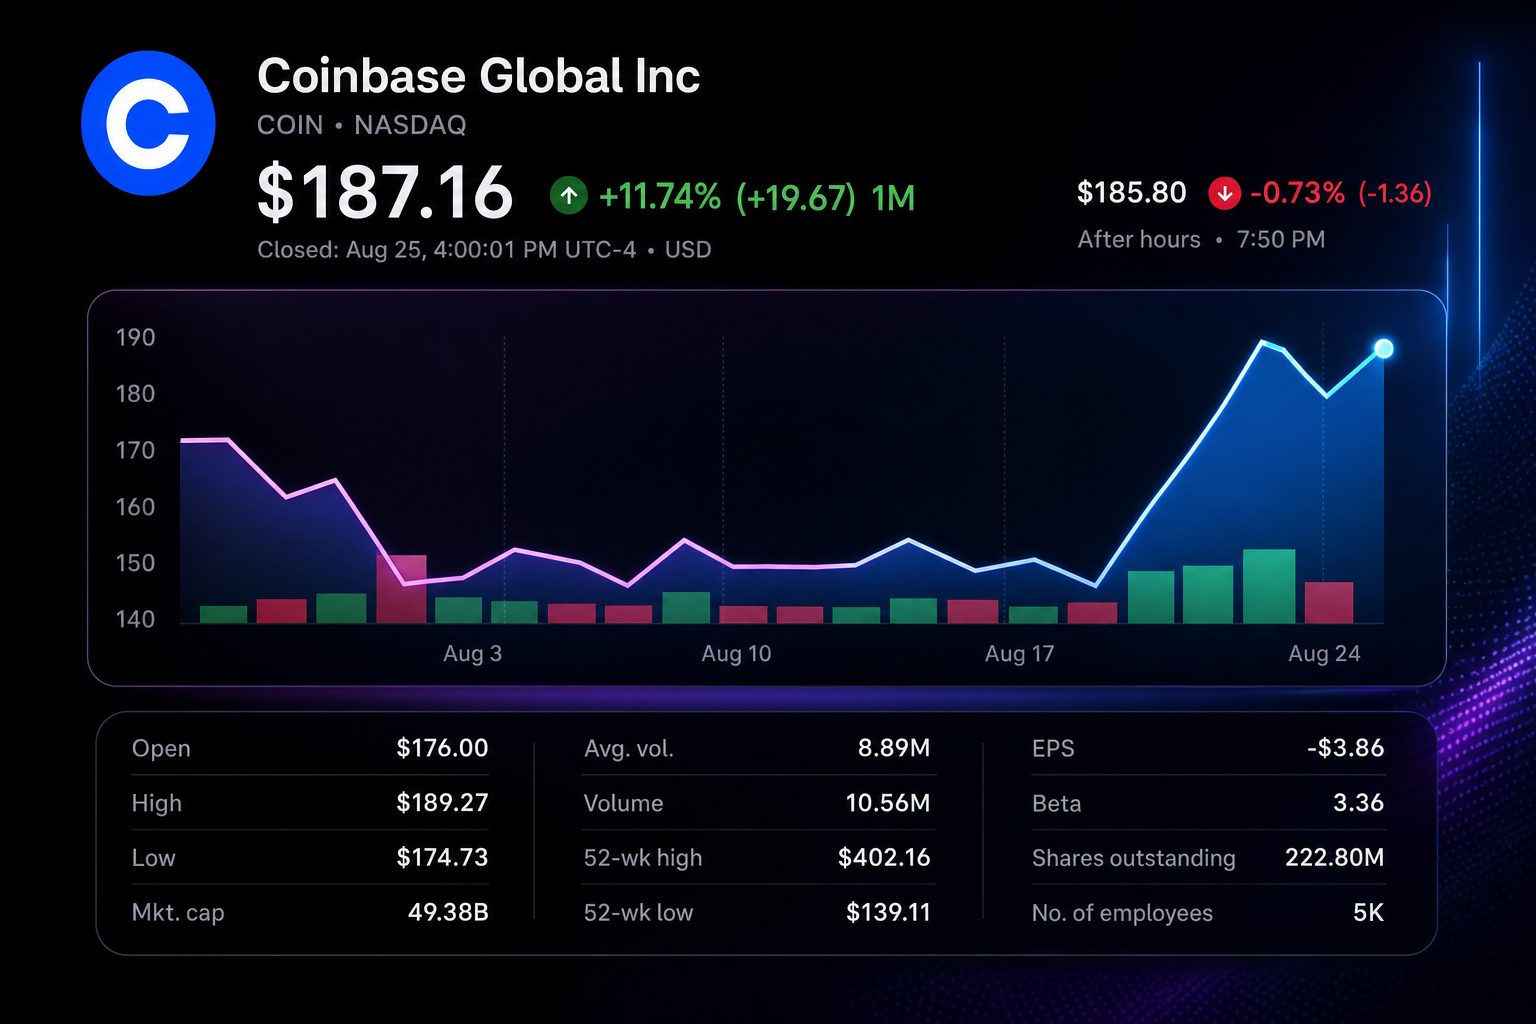
| Coinbase | $187.16 | +4.28% | $49.38B | 162.8× | +5.0% |
| Cboe Global Markets | $308.82 | +0.24% | $32.25B | 21.3× | +2.1% |
| Intercontinental Exchange | $161.78 | −0.74% | $90.82B | 19.7× | +14.6% |
| Nasdaq | $98.73 | −0.06% | $55.19B | 22.6× | +11.2% |
| CME Group | $277.32 | −0.66% | $99.72B | 22.5× | +2.1% |
Peer data are as of the August 25 U.S. close. The comparison shows Coinbase's greater earnings sensitivity to digital-asset activity and product adoption.
Consensus across 34 analysts, with an average target of $196.55.
The target implied 5.0% upside from the August 25 close. That is smaller than the stock's single-day 4.28% move.
Tuesday's price action treated tokenized equities as a credible extension of Coinbase's platform. The measurable evidence is the stock move, not product revenue. With only four securities and no disclosed fee schedule, adoption data now matter more than launch-day attention.
The range is based on Tuesday’s close and an 8% options-implied move through week-end. It describes expected volatility, not a forecast of direction.
| Metric | Reference | Investor test |
|---|---|---|
| Revenue | $1.436B–$1.442B | Hold or beat midpoint |
| Adjusted EPS | $0.29 estimate | Post-split basis |
| ARR | $5.793B–$5.795B | Fresh bookings matter |
| Non-GAAP operating income | $345.6M–$349.1M | About 24.1% margin |
The Q2 midpoint implies roughly 11% more net new ARR than Q1. Reported balance rounding makes this calculation approximate.
| Company | Aug. 25 close | Daily move | Forward P/E | Analyst target upside |
|---|---|---|---|---|
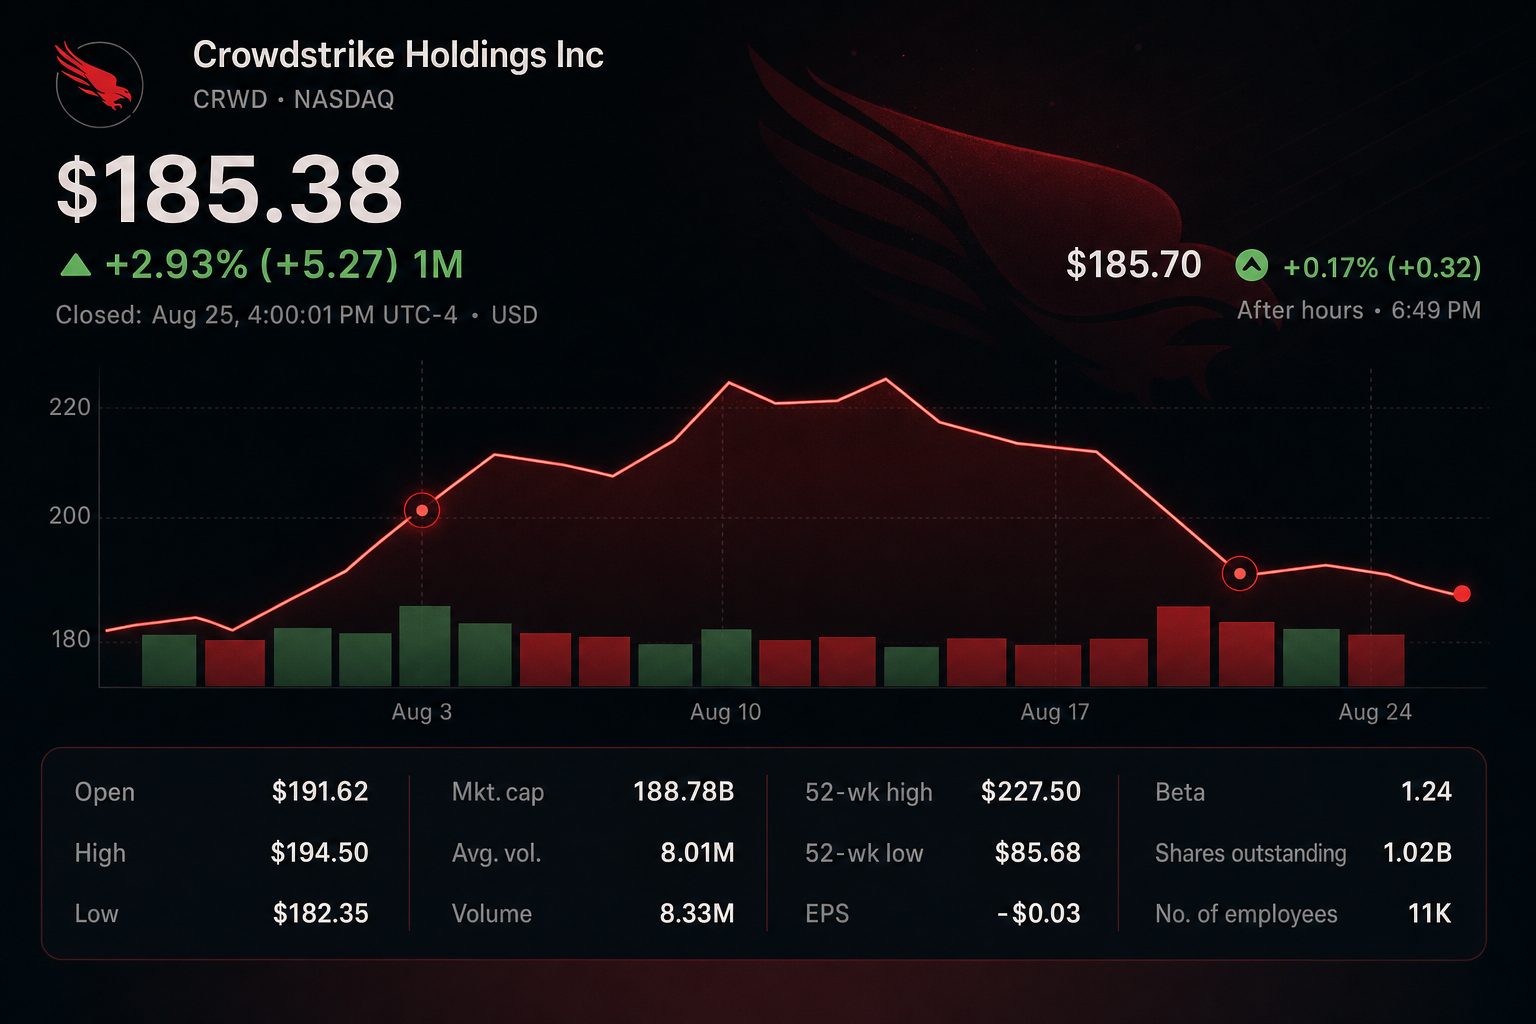
| CrowdStrike CRWD | $185.38 | −2.78% | 146.1× | +13.6% |
| Palo Alto Networks PANW | $339.90 | −3.13% | 89.6× | +6.7% |
| Zscaler ZS | $168.42 | −4.34% | 39.7× | +18.0% |
| Fortinet FTNT | $153.66 | +1.10% | 43.4× | +4.7% |
Peer weakness makes earnings-specific attribution difficult. CrowdStrike’s premium multiple raises the bar for guidance and contracted subscription growth.
The options range can overstate or understate the actual reaction. A headline revenue beat may not support the shares if ARR, net new bookings or guidance disappoint. Conversely, stronger contracted revenue and margins could outweigh a modest earnings miss. The after-hours market is also thinner than the regular session.
Market data through August 25, 2026, 16:42 EDT
Closing prices; after-hours marker shown for Tuesday.
Reported dispute-rate threshold.
| Exit condition | <1.5% |
| Required duration | 3 months |
| Surcharge | $8 / dispute |
| September bill | ≈$75K |
| Implied disputes* | ≈9,375 |
*Derived by dividing $75,000 by the reported $8 surcharge; actual program billing may differ.
| Measure | Latest | Investor signal |
|---|---|---|
| Q2 revenue | $753.2M | +38% YoY |
| Subscribers | 2.891M | +19% YoY |
| Average monthly revenue / subscriber | $92 | +21% YoY |
| Visa-related reported fee | ≈$75K | Small direct cost |
| Two-session equity loss | ≈$474M | Trust risk priced |
| Q2 measure | 2026 | 2025 |
|---|---|---|
| Revenue | $753.2M | $544.8M |
| Gross margin | 64% | 76% |
| Net income / loss | -$86.3M | $42.5M |
| Adjusted EBITDA | $60.3M | $82.2M |
| Free cash flow | -$68.2M | -$69.4M |
| Q3 revenue guide | $880–900M |
| Midpoint growth QoQ | ≈18.2% |
| Q3 adjusted EBITDA | $75–95M |
| FY26 revenue | $3.1–3.3B |
| FY26 adjusted EBITDA | $275–325M |
| Set / firm | Rating | Target |
|---|---|---|
| 15-analyst consensus | Hold | $31.23 avg. |
| Consensus range | $23–$42 | -27.6% to +32.3% |
| Barclays, Aug. 21 | Equal Weight | $35 |
| Truist, Aug. 24 | Hold | $32 |
Quoted equity value to trailing revenue at Tuesday’s close.
Watch: dispute-rate remediation, refunds, subscription churn, FTC litigation, gross-margin mix and the conversion of 47%–50% guided Q3 growth into cash.
Sources: Hims & Hers Q2 2026 release and SEC filing; FTC complaint; Bloomberg details republished by Investing.com; StockAnalysis market and S&P Global analyst data. Derived figures may differ slightly because of rounding.
Revenue mix from Robinhood’s August 5, 2026, second-quarter release. Subcategories overlap the transaction total and therefore do not sum to total revenue.
| Metric | July 2026 | Month over month | Year over year |
|---|---|---|---|
| Equity notional | $332.8B | −15% | +59% |
| Options contracts | 324.2M | +2% | +66% |
| Crypto notional | $10.9B | −33% | −62% |
| Robinhood App crypto | $4.3B | −38% | −74% |
| Event contracts | 6.1B | −5% | +20× |
| Net deposits | $5.6B | 18% annualized rate | — |
The 76× ratio is a sensitivity marker. It shows how strongly investors linked Tuesday’s Bitcoin move to future trading activity, despite crypto’s small current share of Robinhood revenue.
A durable signal would pair stronger crypto notionals with continued deposit growth. Options, equities and event contracts would need to remain firm.
Bitcoin gave back part of its early rise. HOOD’s 49.64× trailing P/E leaves the shares exposed if activity fails to follow price.
Market data through August 25, 2026, 16:49 EDT · 22:49 CEST
Interactive Brokers will provide brokerage infrastructure behind Daol Investment & Securities’ platform for eligible South Korean investors seeking global equities. The companies disclosed no fees, customer targets or launch-volume commitments.
| Metric | Q2 2026 | YoY | Investor signal |
|---|---|---|---|
| Net revenue | $1.90B | +28% | Scale |
| Commissions | $673M | +30% | Trading activity |
| Net interest income | $1.06B | +23% | Balance-sheet yield |
| Customer accounts | 5.19M | +34% | Distribution |
| Customer equity | $930.3B | +40% | Asset depth |
| DARTs | 4.82M | +36% | Monetizable volume |
| Margin loans | $108.5B | +67% | Interest income |
| Net interest margin | 1.93% | −14 bp | Rate sensitivity |
Consensus: Buy from 12 analysts. The average target implies 8.1% upside. Goldman Sachs maintained Buy on August 25. Trailing P/E was about 39 times near the close.
| DARTs | 4.426M | +27% |
| Accounts | 5.317M | +34% |
| Client equity | $906.7B | +32% |
| Margin loans | $100.7B | +49% |
| Avg. commission | $2.56 | per order |
The Daol agreement has no disclosed economics. Adoption can lag distribution announcements. A lower rate environment may pressure net interest margin. South Korean rules and cross-border market access can slow onboarding.
Sources: Interactive Brokers and Daol announcement; Interactive Brokers Q2 2026 Form 10-Q; July brokerage metrics; StockAnalysis market and analyst data. Figures are current to the timestamp shown and are not investment advice.
| Q2 2026 | Reading |
|---|---|
| Net sales | $26.54B · +5.3% |
| Comparable sales | +3.8% |
| Comparable traffic | +3.6% |
| Store comparable sales | +2.7% |
| Digital comparable sales | +8.7% |
| Operating margin | 9.6%* |
| Consensus | Hold |
| Average target | $161.62 |
| Range | $121–$200 |
| Analysts | 38 |
| Average target vs. close | −1.1% |
| Product review | Specific control changes |
| Halloween quarter | Traffic and markdowns |
| Digital channel | Whether 8.7% growth holds |
| Guidance | ~5% sales growth |
| Next earnings | Expected Nov. 18 |
| Metric | Actual | Street | Beat |
|---|---|---|---|
| Revenue | $4.354B | $4.27B | +2.0% |
| Adjusted EPS | $4.03 | $3.58 | +12.6% |
| Online Ecosystem | $2.6B | — | +17% YoY |
| Credit Karma | $743M | — | +16% YoY |
The definition change narrows the apparent EPS miss. The revenue midpoint of $4.304B still trails the $4.35B consensus by about 1.1%.
| Firm / group | Rating | Target | Upside vs close |
|---|---|---|---|
| Jefferies | Buy | $500 | 39.3% |
| Citi | Buy | $457 | 27.3% |
| 35-analyst avg. | Buy | $446.02 | 24.3% |
| TD Cowen | Hold | $328 | −8.6% |
Market close · August 25, 2026 · 16:00 EDT
Ontario named uranium as possible trade leverage. Oklo rallied, though no cutoff or new Oklo contract was announced.
The session's added value equaled 6.7× Oklo's $126.9M first-half capital spending. That is a sentiment move, not realized cash flow.
| Metric | Amount |
|---|---|
| Cash + marketable securities | $3.01B |
| H1 ATM equity proceeds | $1.85B |
| H1 operating cash use | $65.5M |
| H1 capital spending | $126.9M |
| 2026 operating cash-use guide | $120–150M |
| 2026 PP&E guide | $400–500M |
Balance-sheet figures through June 30, 2026. Source: Oklo Form 10-Q and Q2 call.
| Measure | Target / view |
|---|---|
| Consensus | Buy · 15/9/1 |
| Average target | $79.88 · +80% |
| Median target | $81.50 · +84% |
| Truist | Hold · $51 |
| H.C. Wainwright | Buy · $90 |
| Canaccord | Buy · $100 |
Latest compiled targets available August 25; recent firm calls dated August 10.
Policy riskHALEU accessGroves executionAurora scheduleEquity dilution
Oklo has enough liquidity to fund near-term work, but its $8.23B value still depends on regulatory progress and future commercial deployment. The uranium threat supports the strategic case for domestic fuel. It does not itself create revenue. A reversal in trade rhetoric could therefore unwind part of Tuesday's gain.
Sources: Yahoo Finance close and volume; Oklo Q2 2026 Form 10-Q; Oklo Groves first-criticality release; Reuters and AP trade reporting; S&P Global analyst compilation. All market figures as of August 25, 2026, 16:00 EDT.
Tuesday's market-value gain alone equals 4.35× funded backlog and 476× first-quarter revenue. Wednesday's report must show how signed work reaches the income statement.
| Metric | Q1 2026 / Mar. 31 | Read-through |
|---|---|---|
| Revenue | $0.594M | +57% year on year |
| Cost of revenue | $5.01M | Scale not yet economic |
| Net loss | -$7.71M | Early-stage spending |
| Cash | $124.9M | Before $150M IPO |
| Funded backlog | $65M | Binding work |
| Firm | Rating | Target |
|---|---|---|
| RBC Capital | Outperform | $11 |
| BofA Securities | Buy | $15 |
| Stifel | Buy | $16 |
| Barclays | Overweight | $17 |
| Evercore ISI | Outperform | $17 |
| Goldman Sachs | Buy | $18 |
Binding supply of multiple metric tons of TRISO fuel through 2031 for Radiant's one-megawatt Kaleidos microreactors.
NYSE: RBRK · Fiscal Q2 2027 setup · Market snapshot: August 25, 2026, 14:33 EDT
The chart uses verified closes through Aug. 21 and the Aug. 25 intraday snapshot. The stock remains about 26% above its July 31 close despite Tuesday's drop.
| Metric | Latest / guide | Signal |
|---|---|---|
| Q1 revenue | $387.1M; +39% YoY | Growth |
| Q1 subscription ARR | $1.57B; +32% YoY | Core demand |
| Q1 free cash flow | $73.6M; 19% margin | Leverage |
| Q2 revenue guide | $395M–$397M | +27.7% YoY at midpoint |
| Q2 adjusted EPS guide | $0.03–$0.05 | Profitable |
| FY27 revenue guide | $1.638B–$1.648B | Valuation base |
| FY27 free-cash-flow guide | $293M–$303M | ≈18.1% midpoint margin |
| Firm / sample | Rating | Target | Implied move |
|---|---|---|---|
| Wells Fargo | Overweight | $120 | +31.9% |
| Oppenheimer | Outperform | $120 | +31.9% |
| Cantor Fitzgerald | Overweight | $120 | +31.9% |
| KeyBanc | Overweight | $112 | +23.1% |
| 27-analyst consensus | Strong Buy | $103.07 | +13.3% |
ARR growth below expectations, cautious forward guidance, or heavier investment could compress the revenue multiple. The stock's August rally also raises the threshold for a favorable post-earnings reaction.
Sources: Rubrik investor relations, Yahoo Finance, Wells Fargo research summary, S&P Global analyst compilation and company guidance. Time-sensitive market figures are stamped August 25, 2026, 14:33 EDT.
| Analyst | Rating | Prior | New | Vs. $240.91 |
|---|---|---|---|---|
| Susquehanna · Christopher Rolland | Buy/Positive | $230 | $265 | +10.0% |
| Rosenblatt · Sajal Dogra | Buy | $240 | $300 | +24.5% |
| Morgan Stanley · Joseph Moore | Hold | $195 | $224 | −7.0% |
| Benchmark · Cody Acree | Buy | $275 | $275 | +14.2% |
A result above the $2.70 billion midpoint must be paired with a stronger forward view to justify Tuesday’s value creation.
Custom silicon can accelerate sales while diluting gross margin. The 58.25% floor is the clean checkpoint.
Investors need evidence that optical, switching and custom-XPU bookings convert into dated revenue.
| Cash + marketable securities | $2.364B |
| Cash as share of market cap | 40.5% |
| Q2 revenue | $10.2M |
| Q2 R&D expense | $67.2M |
| Q2 net loss | $91.2M |
| CASGEVY Q2 global revenue | $76M |
| Firm | Latest action | Rating | Target | Implied return |
|---|---|---|---|---|
| Citizens | Aug. 25 | Market Outperform | $80 | +32.5% |
| Goldman Sachs | Aug. 10 | Hold | $55 | −8.9% |
| Bank of America | Aug. 5 | Buy | $82 | +35.8% |
| Morgan Stanley | Aug. 4 | Hold | $60 | −0.6% |
| Piper Sandler | Aug. 4 | Buy | $110 | +82.2% |
A durable ANGPTL3 response could add an in-vivo cardiovascular franchise beside CASGEVY. Tuesday's move capitalized that possibility before the data.
CTX310 is early-stage. Small cohorts, safety findings or weaker durability could erase the move. Clinical value remains distinct from commercial value.
$319 million gained versus $2.364 billion of liquidity. The stock's one-day market-value increase equals roughly 13.5% of reported cash and securities. Citizens' $80 target adds another $1.90 billion of implied equity value from the midday base. The August 28 data therefore tests whether investors will assign meaningful value to CTX310 before later-stage evidence.
Sources: CRISPR Therapeutics Q2 2026 business update; Google Finance; Citizens research note reported by Investing.com. Calculations may differ slightly because market capitalization and shares outstanding are rounded.
| Firm | Rating | Target | Upside |
|---|---|---|---|
| Morgan Stanley | Buy | $22 | 10.6% |
| Piper Sandler | Buy | $24 | 20.6% |
| H.C. Wainwright | Buy | $25 | 25.6% |
| Goldman Sachs | Buy | $26 | 30.7% |
| Guggenheim | Buy | $30 | 50.8% |
Strong volume and a price above the $16 IPO level suggest buyers are absorbing the known supply event. The average analyst target still implies 28.6% upside. Phase 3 severe-asthma studies and near-term COPD data offer clinical catalysts.
The eligible resale pool is more than four times the IPO block. Generate has no approved products or product-sales revenue. A disappointing trial result, faster cash use or broad holder selling could compress valuation and bring forward financing risk.
Sources: Generate Biomedicines Form 10-Q filed Aug. 6, 2026; company Q2 release; Reuters IPO report; Yahoo Finance and StockAnalysis market/analyst data. Live figures timestamped Aug. 25, 2026, 12:36 EDT. Calculations use 128.269M shares outstanding and the $19.90 snapshot.
The board authorized purchases of Class B stock through Aug. 21, 2027. No minimum purchase is required. The board may modify, pause or end the program without notice.
| Firm | Action | Rating | Target | Date | Vs. $1.89 |
|---|---|---|---|---|---|
| Freedom Broker | Upgrade | Hold | $2 | Aug. 16, 2026 | +5.8% |
| H.C. Wainwright | Reiterate | Buy | $6 | Feb. 2, 2026 | +217.5% |
Coverage is sparse. The target spread highlights unusually wide uncertainty around commercialization and valuation.
Market snapshot: August 25, 2026, 11:31 EDT · U.S. regular session
Up 8.63% from a $35.17 prior close.
About $1.96B added during the move.
Shares traded by 11:31 EDT on August 25.
Versus 22.68× for Dell and 21.50× for Cisco.
The $68.5 billion midpoint implies 75.4% growth. Cisco’s October availability is a channel catalyst; no order value has been disclosed.
Consensus: Hold · Average target $42.38 · Implied upside 10.9% from $38.21.
| Company | Price | Daily move | Market value | Forward P/E |
|---|---|---|---|---|
| Super Micro Computer (NASDAQ: SMCI) | $38.21 | +8.63% | $24.71B | 8.81× |
| Dell Technologies (NYSE: DELL) | $453.27 | +4.64% | $292.88B | 22.68× |
| Cisco Systems (NASDAQ: CSCO) | $110.97 | +0.67% | $437.38B | 21.50× |
Prices and valuation metrics: StockAnalysis snapshots at 11:30–11:31 EDT, August 25, 2026. SMCI outperformed the equal-weight daily move of Dell and Cisco by about 6.0 percentage points.
Cisco supplies distribution and enterprise validation. Supermicro supplies dense rack-scale compute and liquid cooling. The commercial link is direct, but not yet quantified: an October product path can widen customer access, while revenue depends on orders, pricing, delivery and margin.
| Q4 FY2026 sales | $11.1B | +93.2% YoY |
| Q4 FY2026 gross margin | 17.5% | +8.0 points YoY |
| Q1 FY2027 sales guide | $14.5–$15.5B | Midpoint +34.9% vs. Q4 |
| FY2027 sales guide | $65–$72B | +66.4% to +84.3% |
Cisco disclosed no committed orders, pricing or margin. Taiwan’s August 24 server-export case adds compliance scrutiny: prosecutors allege 74 of 130 B300 systems reached China through indirect routes, while customs stopped 56. Supermicro says it is not an investigation target and is not accused of wrongdoing.
Sources: Cisco, Supermicro results, Reuters, StockAnalysis market data and analyst consensus. Time-sensitive market figures are stamped August 25, 2026, 11:30–11:31 EDT.
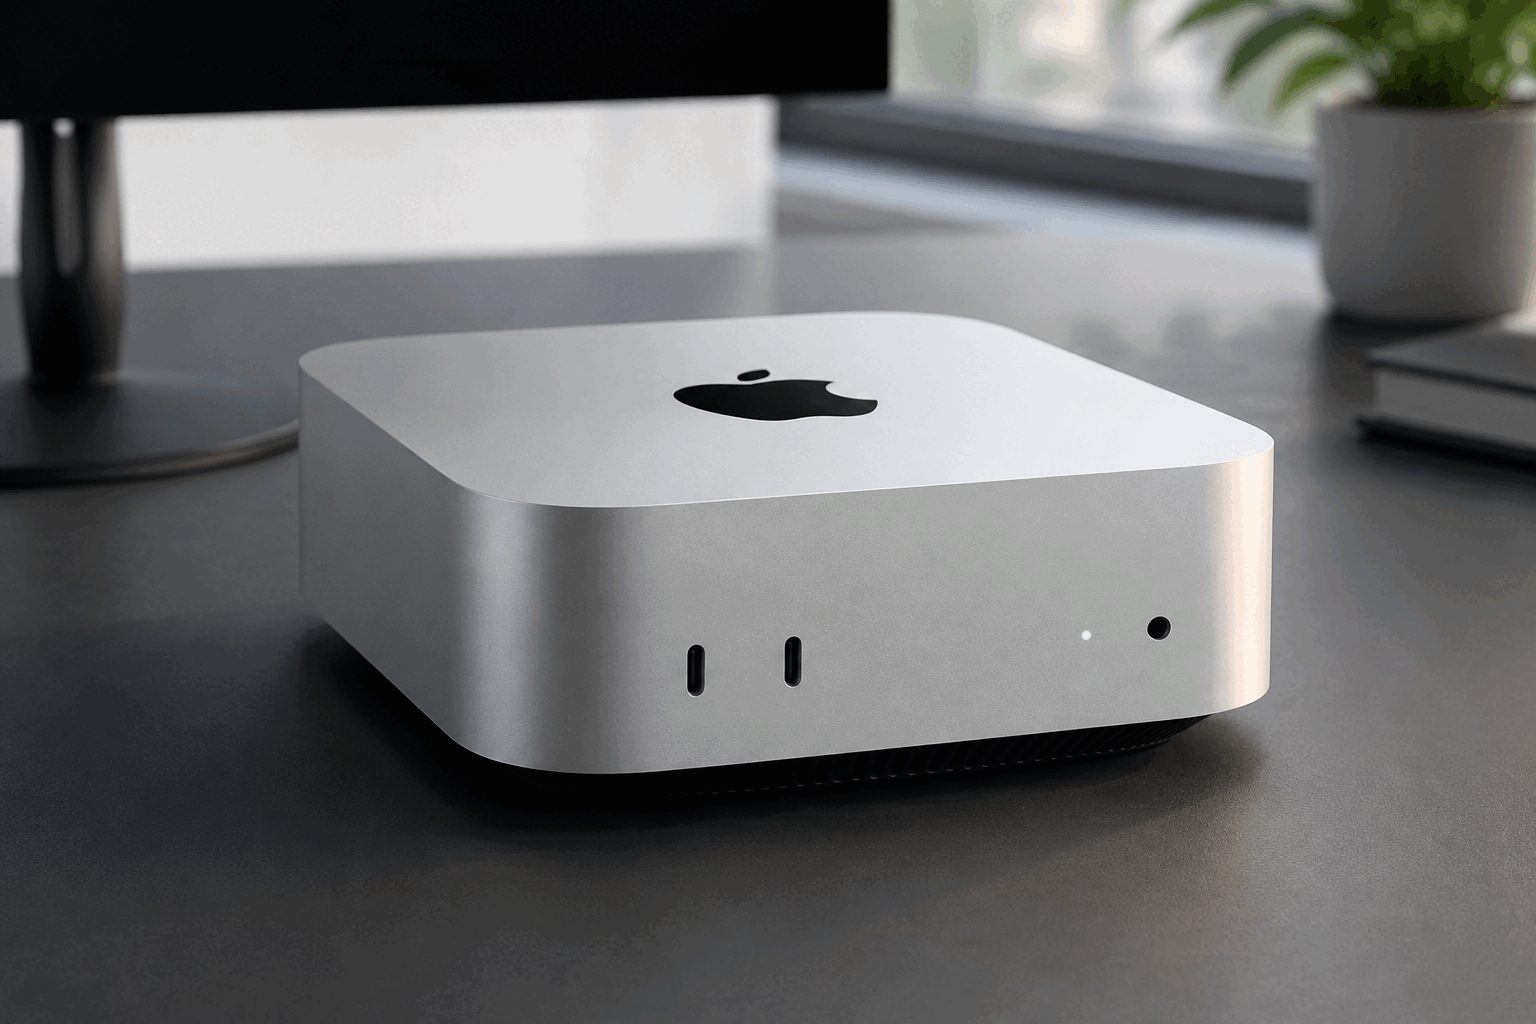
The M6 Mac mini raises the entry price 12.5%. The investor question is whether constrained local-AI demand protects margin without choking unit growth.
Quarter ended June 27; USD billions
Both new starting prices are $100 above the latest M4 generation. The base percentage increase is twice the Pro increase.
Performance figures are Apple claims versus M4; real workloads may differ.
| Signal | Bull case | Bear case | Next evidence |
|---|---|---|---|
| Delivery times | Long waits confirm AI demand | Lost shipments cap sales | September 22 availability |
| Mac growth | 29% momentum persists | Launch pull-forward fades | Fiscal Q4 category sales |
| Pricing | $100 protects gross profit | 12.5% entry hike hurts units | Retail discounts and mix |
| Valuation | AI hardware earns premium | 35.6× P/E limits upside | Guidance and estimate revisions |
Sources: Apple fiscal Q3 release and SEC Form 10-Q; Google Finance; The Verge; 9to5Mac; Fortune. Market data captured August 25, 2026, 09:27 EDT. Product performance figures are manufacturer claims. Calculations may not sum due to rounding.
| Edition | Price |
|---|---|
| Standard | $79.99 |
| Ultimate | $99.99 |
| Upgrade | +$20 / +25% |
| Metric | Reading |
|---|---|
| Q1 FY27 net bookings | $1.39bn · −3% YoY |
| Q1 GAAP revenue | $1.53bn |
| Q1 GAAP net result | −$34.1m |
| Recurrent share of bookings | 84% |
| FY27 GAAP revenue outlook | $7.9–8.1bn |
| FY27 operating cash flow | >$1.0bn |
| Firm · date | View | Target |
|---|---|---|
| JPMorgan · Aug 11 | Overweight | $310 |
| Roth · Aug 10 | Buy | $300 |
| Wells Fargo · Aug 10 | Overweight | $300 |
| Oppenheimer · Aug 10 | Outperform | $280 |
| BTIG · Aug 10 | Buy | $313 |
High preview engagement converts into stronger pre-orders and an above-plan Ultimate mix. A 10m-edition upgrade scenario adds $200m of gross consumer spending.
The preview stabilizes marketing control. Fiscal 2027 bookings remain near the $8.1bn midpoint and the November 19 launch holds.
Technical criticism, weak premium mix or another delay narrows the valuation gap. Muted engagement after Aug. 27 is the first observable warning.
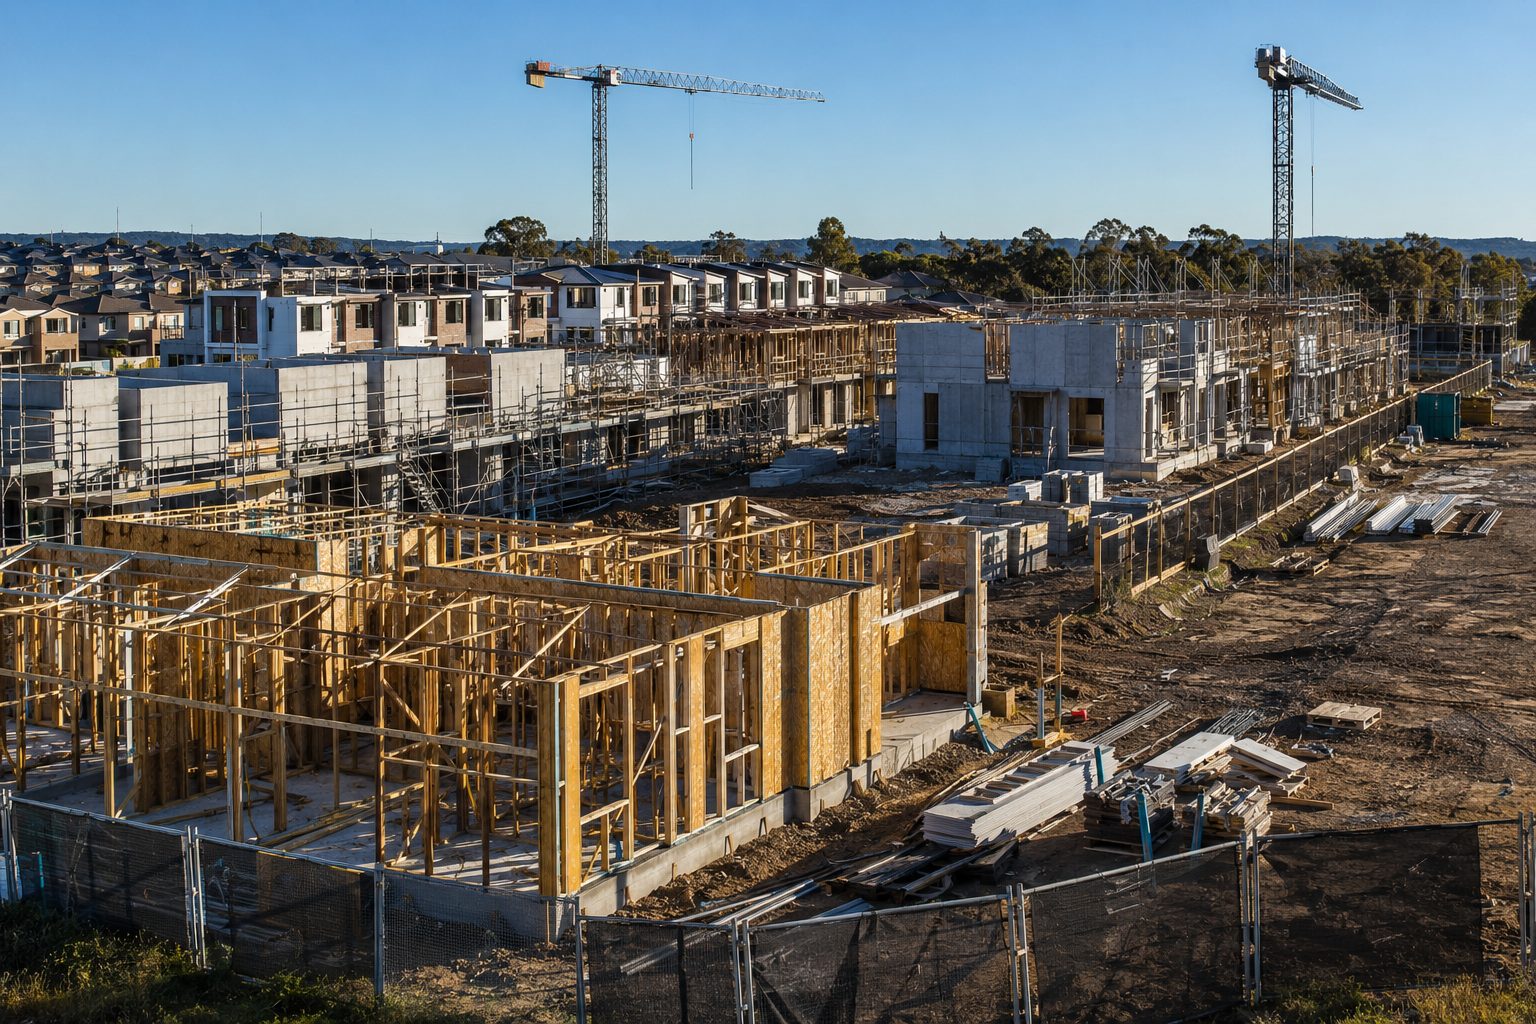
The administration is larger than one listed lender’s balance-sheet exposure. The key variables are fund-level loan concentration, project completion and the time required to turn first-mortgage security into cash.
Bars use separate scales: the first two compare borrower liabilities and CNI’s direct loan; the ASIC bar is a market snapshot, not Bathla exposure.
| Item | Current reading | Investor implication |
|---|---|---|
| Administrator | Teneo; Universal Property Group and Raj & Jai Construction | Control shifts to project stabilisation and creditor recovery |
| Bathla pipeline | 5,000+ homes on company website | Completion delays can tighten western Sydney supply |
| Centuria security | First mortgages; partial cross-collateralisation | Recovery depends on asset values and timing |
| ASIC private-credit survey | 22 managers, 52 funds, ~A$76bn AUM | Valuation and concentration are active enforcement themes |
| RBA system view | Private credit below 2% of financial-system assets | Systemic risk appears contained; fund-level risk can still be material |
| Next catalyst | First creditors’ meeting reported for 4 Sep 2026 | Watch secured debt, cash needs and project-by-project recovery |
| Firm | Rating | Target |
|---|---|---|
| Jefferies | Buy | $120 |
| Raymond James | Buy | $130 |
| Deutsche Bank | Hold | $113 |
| Signal | What it means | Next check |
|---|---|---|
| CPI-W | The statutory COLA input; July is only one of three deciding months. | August CPI — Sept. 11 |
| Gross benefit | A 3.5% midpoint implies about $73 more monthly for an average retired worker. | Official COLA — Oct. 14 |
| Net benefit | Medicare Part B premiums can absorb part of the headline increase. | Premium notice — autumn |
| Retail read-through | Helpful for nominal budgets, but food, fuel and rent can take the cash first. | WMT Q3 — next earnings |
Today’s highest-ranked model selections.
The catalysts most likely to move markets.
A large surprise can reset expectations for household spending and near-term growth, with read-through to Treasuries, USD and cyclical stocks.
Housing remains highly rate-sensitive; the print can move homebuilders, mortgage-sensitive names and the long end of the Treasury curve.
Guidance can influence software multiples and sentiment around U.S. small-business activity.