UiPath Inc. heads into earnings week with a high level of short interest and expectations for a strong rebound priced into the stock. Shares…
·3 min read
NYSE: PATH · Stock move
UiPath earnings pressure map
A 39% monthly rally meets high short interest and a slower sequential ARR build.
Market: Aug. 28, 2026, 16:00 EDT Prepared: Aug. 31, 2026, 00:10 EDT
Friday close
$18.15
−0.98% · −$0.18
Volume
53.13M
79% of 65-day average
Short interest
29.27%
117.88M shares
One-month move
+39.08%
Five-day gain: +9.54%
Operating benchmarks
Metric
Q1 FY2027
Next test
Revenue
$418M · +17% YoY
$395M–$400M Q2 guide
ARR
$1.901B · +12%
$1.929B–$1.934B
Net new ARR
$49M
≈$30.5M implied midpoint
Net retention
109%
Stabilization or reacceleration
GAAP operating income
$28M
Profit durability
Adjusted free cash flow
$130M
Cash conversion
Positioning gauge
High short interest can accelerate covering on a beat or deepen a reversal after a miss.
Market value
$9.4B
P/E: 29.95×
Cash + securities
$1.42B
15% of equity value
Implied EV / ARR
≈4.1×
Using Q2 ARR midpoint
52-week range
$9.20–$19.84
Close is 8.5% below high
Catalyst calendar
Sep. 3
Q2 FY2027 results After close; call at 5:00 p.m. EDT.
Sep. 22
Investor Day 2026 11:30 a.m. PDT; strategy and long-term model.
FY2027
Full-year guide Revenue $1.776B–$1.781B; non-GAAP operating income ≈$430M.
What can break the setup
ARR growth below 12%, net retention slipping from 109%, weaker federal or international demand, and poor conversion of agentic pilots into production contracts would challenge the rerating.
Banco Azteca provides operating proof: 300+ automations across 8,800+ processes. It does not disclose UiPath contract value.
SANTA CLARA, California, August 30, 2026, 23:05 – Marvell Technology stock declined 10.3%, erasing $22 billion from its market capitalization after the company said…
·3 min read
NASDAQ: MRVL · Stock move
Marvell: record growth meets a 2029 payoff test
The quarter beat guidance, but the Google custom-silicon ramp remains back-loaded. Valuation still demands sustained acceleration.
Market data: Aug. 28, 2026, 16:00 EDT Prepared: Aug. 30, 2026, 23:11 EDT
Friday close
$216.62
−10.28% · −$24.83
After-hours: $216.40 at 19:59 EDT
Equity value erased
≈$22.3B
Using roughly 900M basic shares
Q2 revenue
$2.739B
+37% YoY · +13% sequentially
Analyst median target
$295
+36.2% vs Friday close
FactSet via WSJ, Aug. 28
Operating momentum
Q2 revenue
$2.739B
Q3 midpoint
$3.150B
Data center
79%
Gross margin
58.9%
Stock move
−10.28%
Catalyst timeline
Aug. 18Google warrant issued at $206.58 for up to 58.97M shares.
Aug. 27Record Q2 results; FY2027 and FY2028 revenue outlooks raised.
Oct. 6Investor Day: next confirmed strategy and long-term target update.
Fiscal 2029Management expects Google revenue to become much more significant.
Valuation and expectations
Metric
Marvell
Reference
Forward P/E
58.41×
Broadcom 32.15×
FY2027 EPS estimate
$4.20
$4.04 three months ago
FY2028 EPS estimate
$6.69
$6.13 three months ago
Ratings
30 Buy · 7 Overweight
6 Hold · 0 Sell
Target range
$211.97–$400
Median $295
What changed
Beat: Revenue was $39M above prior guidance midpoint. Adjusted EPS of $0.94 topped the $0.93 consensus.
Guide: Q3 revenue midpoint implies about 15% sequential growth.
Disconnect: The Google agreement can support up to $120B of cumulative custom-product revenue, but the strongest contribution is not expected until fiscal 2029.
Investor bridge
Friday's decline removed about $22.3B of equity value even as quarterly revenue grew 37%. The central question is timing: Marvell must convert its Google and other hyperscaler programs into revenue quickly enough to justify a forward earnings multiple roughly 82% above Broadcom's.
Risk monitor
Timing: Google revenue may arrive later than expected.
Concentration: Four customers represented 72% of receivables.
Margin: Q3 adjusted gross-margin guidance is 57.5%–58.5%.
Supply chain: About 84% of quarterly sales shipped to customers operating in Asia.
Ambev S.A. declined 0.69% on Friday. Trading volume was 30.16 million American depositary shares, approximately 7% above the stock’s usual average. The drop cut…
·3 min read
NYSE: ABEV · STOCK MOVE · Yahoo Most Active #20
Ambev: margin recovery meets cautious positioning
Market: Aug. 28, 2026, 16:00 EDT Prepared: Aug. 30, 2026, 23:12 BRT
Friday close
$2.86
−0.69% · −$0.02
Trading volume
30.16M
1.07× recent average
Market value
$45.0B
≈$310M erased
Valuation
14.6×
Trailing P/E · 7.9× EV/EBITDA
Price context
The ADR is 17.1% below its 52-week high and 36.2% above its low.
2Q26 operating bridge
Metric
Result
YoY
Volume
39.73M hl
+1.4%
Net revenue
R$20.15B
+6.1%
Normalized EBITDA
R$6.38B
+8.9%
Normalized profit
R$3.49B
+23.3%
Operating cash flow
R$4.71B
+54.5%
EBITDA margin
31.6%
+80 bps organic
Brazil Beer
+5.0%
Volume · EBITDA +12.8%
Digital growth
+58%
BEES Marketplace GMV
Shareholder yield
4.23%
Trailing dividend · $3.28 target
Analyst stance
Rating
Count
Share
Buy
3
17%
Neutral
10
56%
Sell
5
28%
18 firms listed by Ambev. The $3.28 published average target implies about 15% upside.
What moves the thesis
Bull case: Premium volumes and digital ordering sustain revenue growth above costs.
Bear case: Brazil demand fades while FX and commodities push cash cost per hectoliter toward the top of the 4.5%–7.5% guide.
Next confirmed cash catalyst: R$1.9B interest-on-capital tranche scheduled for Oct. 6, 2026.
Investor bridge
Friday's routine decline contrasts with accelerating operating cash flow and a recovered 31.6% EBITDA margin. The stock's 14.6× earnings multiple and 4.2% yield look defensive, but the 3 Buy / 10 Neutral / 5 Sell split shows that investors still need proof World Cup-linked volume and premiumization can persist.
Sources: Ambev 2Q26 release and analyst coverage; Yahoo Finance Most Active; Finviz market data; UOL/DataWise+ B3 activity ranking. Figures are time-stamped above.
Coeur Mining, Inc. fell 4.86% Friday to $21.13. The decline erased roughly $1.1 billion from its equity value.
·2 min read
Coeur Mining CDE
NYSE · STOCK MOVE · Market data: August 28, 2026, 16:00 EDT · Prepared August 30, 2026, 21:09 EDT
Friday close
$21.13
−4.86% · −$1.08
Equity value
$21.72B
≈$1.1B erased
Volume
24.37M
0.64× recent average
Analyst target
$23.32
+10.36% implied
Friday performance: the equity moved far more than metals
CDE underperformed gold futures by 4.23 percentage points and silver futures by 3.94 points. The selloff priced commodity sensitivity more aggressively than the underlying one-day metals move.
Valuation bridge
2026 adjusted EBITDA guide
$2.3B
Market cap / guided EBITDA
9.4×
2026 free-cash-flow guide
$1.5B
Guided FCF yield
6.9%
Quarter-end cash
$1.1B
52-week range
$12.92–$27.77
Valuation ratios use the August 28 market value and management's August 5 guidance.
Operating dashboard
Metric
Q2 2026
Change
Revenue
$1.1B
+27% q/q
Adjusted EBITDA
$478M
Record
Free cash flow
$388M
+45% q/q
Gold production
163,490 oz
+69% q/q
Silver production
4.4M oz
Flat q/q
Silver share of revenue
30%
Q2 mix
What moves the next quarter
Cash conversion
Management's $1.5B full-year FCF target equals 6.9% of market value.
Target-price cushion
The $23.32 consensus target leaves only 10.4% upside after Friday's decline.
Next confirmed catalyst
November 11, 2026 Expected third-quarter earnings report.
Investor read-through
Record production and the first full quarter of New Afton and Rainy River support Coeur's cash-flow case. The $1.1 billion Friday value loss shows that metals prices still dominate near-term trading. The key test is whether integration and mine performance preserve the $2.3 billion EBITDA and $1.5 billion free-cash-flow outlook if gold and silver weaken.
Risks: metals prices, grade and recovery variability, mine integration, permitting, inflation, operational disruptions and revised guidance.
B2Gold Corp. said an employee died Friday at its Masbate Gold Project in the Philippines after a pipe burst during scheduled maintenance at the…
·2 min read
Investor dashboard
B2Gold Corp. · NYSE American: BTG
Market: Aug. 28, 2026, 16:00 EDT Incident statement: Aug. 28, 2026, 16:32 EDT
Friday close
$5.66
−2.92%
Volume
39.27M
≈1.6× recent average
Market value
$7.47B
≈$224M erased
Consensus target
$6.15
Buy · +8.7%
Masbate’s portfolio weight
Masbate economics · Q2 2026
Gold revenue
$244.8M
Production
51,039 oz
Realized price
$4,389/oz
Cash cost
$804/oz
All-in sustaining cost
$1,236/oz
Masbate AISC was 48% below B2Gold’s $2,356 consolidated level.
Group financial signals
Q2 revenue
$789.4M
Reported net income
$417M
Adjusted net income
$41M
Free cash flow
−$258M
Forward P/E
6.3×
Dividend yield
1.41%
Next verification points
Safety response, then operating continuity
The stock move came before the 16:32 EDT disclosure. Watch the investigation, corrective measures, Philippine regulatory response and any revision to Masbate’s 180–200 koz guidance.
IREN Limited fell 12.53% on Friday after annual results highlighted the expense of turning contracted AI demand into operating cash flow. Shares settled at…
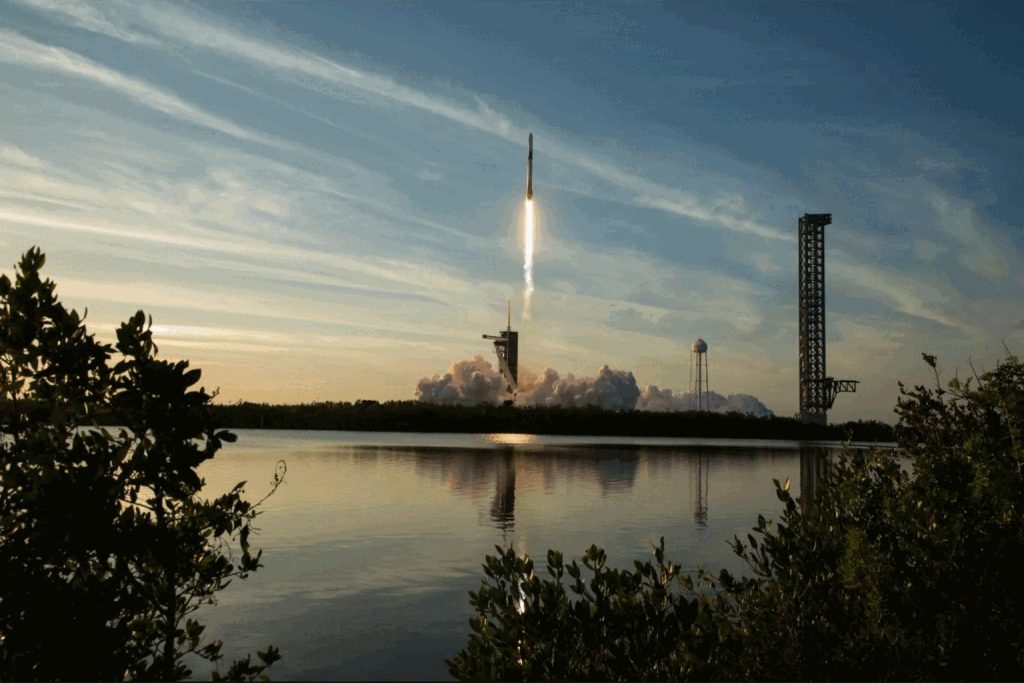
Space Exploration Technologies Corp. rose 0.45% on Friday, closing at $141.50. The increase boosted its market capitalization by roughly $8.4 billion, bringing the total…
·3 min read
Space Exploration Technologies · NASDAQ: SPCX
$1.86T valuation meets an $18.4B capex quarter
Market: Aug. 28, 2026, 16:00 EDT Updated: Aug. 30, 2026, 19:52 EDT
Friday close
$141.50
+0.45% · +$0.63
Market value
$1.864T
≈$8.4B added Friday
Volume
55.1M
47% of 65-day average
52-week high gap
−37.3%
High: $225.64
Q2 revenue mix
Segment
Revenue
YoY
Connectivity
$4.291B
+66%
AI
$2.561B
+247%
Space
$0.962B
+29%
Total
$7.814B
+92%
Capex intensity
2.35× revenue
AI capex
$15.828B
Connectivity capex
$1.367B
Space capex
$1.174B
Total
$18.369B
Earnings bridge
Adjusted EBITDA
$3.538B
Operating loss
−$143M
Net loss
−$541M
EPS
−$0.09
Financial capacity
Cash and securities
$100B
Backlog
$47.5B
IPO net proceeds
$85.7B
Annualized Q2 sales multiple
≈59.6×
Analyst range
Consensus: Overweight · 40 ratings
Investor bridge
Connectivity generated $1.66B of operating income, while AI revenue surged and adjusted EBITDA turned positive. The valuation still assumes that Starlink cash flow can fund Starship and AI buildout without exhausting the $100B liquidity cushion.
Intel Corporation fell 2.85% on Friday, erasing about $13.9 billion in market capitalization. The stock ended the session at $89.47, with trading volume at…
·3 min read
Intel Corporation · NASDAQ: INTC
Recovery meets a $20 billion capital test
Market data: Aug. 28, 2026, 16:00 EDT Updated: Aug. 30, 2026, 19:36 EDT
Friday close
$89.47
−2.85% · −$2.62
Market value erased
$13.9B
Estimated from Friday's move
Volume
86.1M
0.74× three-month average
Consensus target
$107.46
+20.1% implied upside · Hold
$95 offering price versus Friday close
INTC closed 5.8% below the offering price. Net proceeds were about $19.7B.
Quarterly operating recovery
Metric
Q2 2026
YoY
Revenue
$16.1B
+25%
Data Center & AI
$6.3B
+59%
Client computing
$8.9B
+13%
Foundry*
$5.8B
+31%
*Includes intersegment transactions.
Margins and cash
GAAP gross margin
40.4%
GAAP operating margin
11.1%
Operating cash flow
$7.0B
GAAP net loss
−$11.0B
Capital raise
Base shares issued
210.5M
Estimated dilution
≈4.0%
Underwriter option
31.6M
Net proceeds
≈$19.7B
Investor bridge
Friday's rate-driven technology selloff erased about $13.9 billion and left Intel below its financing price. The operating rebound is substantial: revenue grew 25%, data-center sales rose 59% and operating margin turned positive. The next rerating depends on converting roughly $19.7 billion of new capital into durable foundry utilization, margins and free cash flow without further dilution.
Sources: Intel Q2 2026 results; Intel common-stock offering release; Yahoo Finance market data; MarketBeat analyst consensus. Figures may be rounded. This dashboard is informational, not investment advice.
OAKLAND, California, August 30, 2026, 19:08 — PG&E stock declined 7.5%, with about $3 billion in market value lost, after progress on a California…
·3 min read
NYSE: PCG · policy-risk repricing
PG&E wildfire-liability dashboard
Market data: Aug. 28, 2026, 16:00 EDT Prepared Aug. 30, 2026, 19:08 EDT
Friday close
$16.60
−7.52% · −$1.35
Equity value erased
≈$3.0B
Current market cap $36.56B
Share volume
114.4M
5.1× three-month average
2026 guide multiple
≈10.1×
$1.64–$1.66 core EPS
Operating momentum versus policy discount
Q2 core EPS $0.40
Q2 core EPS, prior year $0.31
First-half core EPS $0.83
Non-fuel O&M target −2% to −4%
Analyst target upside
+33.7%
$22.20 average target; ten analysts
The target gap is meaningful, but it depends on wildfire and financing risks declining—not only on delivering guided EPS.
Catalyst timeline
Aug. 28California lawmakers block the governor's wildfire-liability proposal.
Aug. 28 closePCG falls 7.52% on 114.4 million shares.
Aug. 31Legislative deadline focuses attention on any revised compromise.
Next earningsExecution against $1.64–$1.66 core EPS guidance remains the operating test.
Investor scorecard
Signal
Reading
Interpretation
Valuation
≈10.1× guided core EPS
Low multiple reflects liability and capital risk.
Earnings
Q2 core EPS +29% year over year
Utility operations are improving.
Liquidity access
$4.4B utility debt financing in H1
Funding is available, but leverage raises sensitivity.
Policy
Liability proposal rejected
Near-term rerating path weakened.
Trading
5.1× average volume
Policy news triggered a broad repricing.
Investor bridge
Friday's legislative setback erased about $3.0 billion, even as quarterly core EPS rose 29%. The stock's roughly 10× guided-earnings multiple can expand only if California reduces the tail risk attached to wildfire claims and future financing.
Bull case: EPS deliveryBull case: revised liability reformBear case: adverse fire claimsBear case: higher capital costs
BOSTON, August 30, 2026, 18:58 — DraftKings reported a $67.6 million loss after handling $13.1 billion in wagers during the U.S. Open, highlighting the…
·3 min read
DraftKings investor dashboard
U.S. Open attention versus monetization
Market data: Aug. 28, 2026, 20:15 EDT Odds and event context: Aug. 30, 2026, 18:58 EDT
DKNG last trade$25.26▲ 4.2% Friday
Sports volume, Q2$13.1B▲ 15% year over year
Revenue, Q2$1.443B▼ 5% year over year
Consensus target$34.9838.5% implied upside
Growth reached the app; monetization did not
Sports volume
+15%
Monthly payers
+9%
Revenue
-5%
Revenue / payer
-13%
Adjusted EBITDA
-62%
U.S. Open men's headline odds
Player
Odds
Implied*
Carlos Alcaraz
+175
36.4%
Alexander Zverev
+300
25.0%
Novak Djokovic
+800
11.1%
*Unadjusted implied probability. Quotes reported Aug. 30; prices move with betting and news.
What matters: A two-week event can lift visits and handle. Hold, favorite outcomes and promotional cost decide how much becomes revenue.
Quarterly earnings bridge
Metric
Q2 2026
Q2 2025
Revenue
$1.443B
$1.513B
Adjusted EBITDA
$114.6M
$300.6M
Attributable net income
-$67.6M
$157.9M
Monthly unique payers
3.6M
≈3.3M
ARPMUP
$132
$151
2026 guide and market signals
Revenue guide
$6.5B–$6.9B
Adjusted EBITDA guide
$700M–$900M
Market capitalization
$22.47B
Friday share volume
19.9M
Analyst consensus
Buy / 36 analysts
Investor bridge: Q2 sports volume rose $1.7 billion, yet revenue fell $69 million and adjusted EBITDA fell $186 million. U.S. Open traffic helps only if DraftKings restores revenue per payer without paying too heavily for engagement.
A familiar franchise can lower discovery and marketing friction. The financial test is whether September’s new episodes lift retention and ad inventory beyond launch week while preserving a 33.4% operating margin.
Tesla Inc. stock dropped 1.7% on Friday, wiping out approximately $19 billion in market capitalization. The move brought the electric vehicle company's value down…
·3 min read
Tesla investor dashboard
Price premium meets margin pressure
Friday close: -1.71%
TSLA close
$348.75
Aug. 28, 16:00 EDT
Market value
$1.09T
Aug. 28 close
Trailing P/E
323.95×
Google Finance
Trading volume
32.97M
vs. 37.88M average
Quarterly operating profile
Revenue
$28.24B
Auto revenue
$20.52B
Gross profit
$4.75B
R&D
$2.37B
Op. income
$0.40B
Q2 ended June 30, 2026; Tesla shareholder update.
Margin and cash conversion
Free cash flow was -$1.1B, while cash and investments totaled $43.5B.
Wall Street range
View
Count / target
Signal
Buy
11 analysts
Supportive
Hold
14 analysts
Largest group
Sell
3 analysts
Cautious
Average target
$385.05
+10.4%
Target range
$130–$505
Wide dispersion
Google Finance snapshot, Aug. 28, 2026.
Commercial pressure points
Cybertruck base trim
$74,990
Premium AWD trim
$84,990
Recent increase
+$5,000 each
H1 U.S. Cybertruck sales
7,263 est.
Year-on-year change
-32.2%
Prices reported Aug. 26; sales estimate from Cox Automotive.
Investor bridge
Tesla lost about $19 billion of market value on Friday. Its balance sheet funds autonomy, robotics and energy expansion, but a 323.95× earnings multiple leaves little room for delays while operating margin sits at 1.4%.
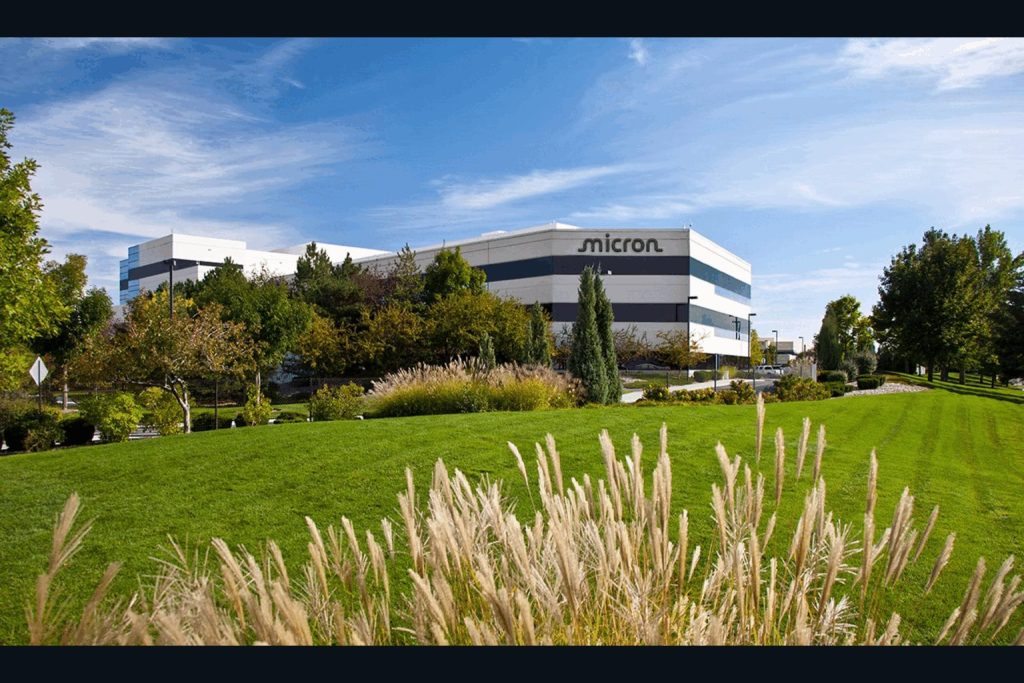
Micron Technology stock declined 0.27% on Friday, despite renewed online interest in a positive outlook following its earnings report. Shares finished at $932.86 and…
·2 min read
NASDAQ: MU · Google Trend: micron
Micron’s $50B quarter sets the bar
Market: Aug. 28, 2026, 16:00 EDT Financials: quarter ended May 28, 2026
Friday close
$932.86
−0.27% · after hours $930.80
Market value
$1.05T
21.12× trailing earnings
Q4 revenue guide
$50.0B
+20.6% sequential midpoint
Q4 gross margin
~86%
+1.4 pts versus Q3
Quarterly revenue and gross margin
Bars: revenueLine: GAAP gross margin
Business mix · Q3
Cloud memory$13.77B
Core data center$11.52B
Mobile & client$11.52B
Auto & embedded$4.63B
Cloud plus core data center supplied 61% of revenue.
Cash conversion
Metric
Q3 2026
Operating cash flow
$25.39B
Capital expenditure
$7.10B
Adjusted free cash flow
$18.30B
Cash and investments
$30.20B
Street expectations
Signal
Value
Buy / Hold / Sell
30 / 1 / 0
Average target
$1,556.55
Implied upside
66.9%
Target range
$1,100–$2,200
What September 30 must prove
Test
Current evidence
Investor read-through
Pricing
86% Q4 gross-margin guide
Durability matters more than another headline beat
AI mix
HBM4 shipping at volume
Supports high-margin data-center concentration
Supply
Rivals plan major capacity
Raises medium-term cycle risk
Cash
$18.3B Q3 adjusted FCF
Funds expansion without near-term balance-sheet strain
Risk monitor
● Faster rival capacity additions
● AI customer inventory correction
● Taiwan labor disruption
● HBM qualification or yield delays
Next confirmed catalyst: fiscal Q4 results, Sept. 30 after the U.S. close.
Sources: Micron Q3 2026 results and IR; Google Finance; Reuters. Market figures timestamped Aug. 28, 2026, 16:00 EDT. Estimates and targets are not guarantees.
Transocean Ltd. closed up 1.05% at $5.80 on Friday. The advance added to a rally supported by stronger cash flow.
·2 min read
NYSE:RIG · STOCK MOVE
Transocean: cash flow meets the debt test
Market data: Aug. 28, 2026, 16:00 EDT Financials: quarter ended June 30, 2026
Friday close
$5.80
+1.05%
Market value
$6.97B
Aug. 28 close
Volume
34.9M
Friday shares
Analyst target
$6.55
+12.9% implied
Quarterly operating bridge
■ Q2 2026■ Q1 2026
Capital structure
Measure
Value
Investor read
Debt principal
$5.11B
73% of equity value
Liquidity
>$1.3B
Operating cushion
Backlog
$6.7B
Revenue visibility
2026 interest guide
$475M
Main cash drag
Backlog excludes a $1.0B Equinor agreement pending approvals.
What changed
Free cash flow rose 56% sequentially even as revenue fell 11%. Stronger working capital and lower capital spending outweighed weaker utilization.
Q2 free-cash-flow increase versus Q1
Valaris combination
Deal measure
Figure
Transaction value
$5.8B, all stock
Combined fleet
73 rigs
Targeted synergies
>$200M
Expected close
Second half 2026
Investor watch
Positive cash generation supports the rally, but one quarter does not settle the leverage case. Watch contract approvals, utilization, merger timing, integration costs and whether debt falls faster than the offshore cycle softens.
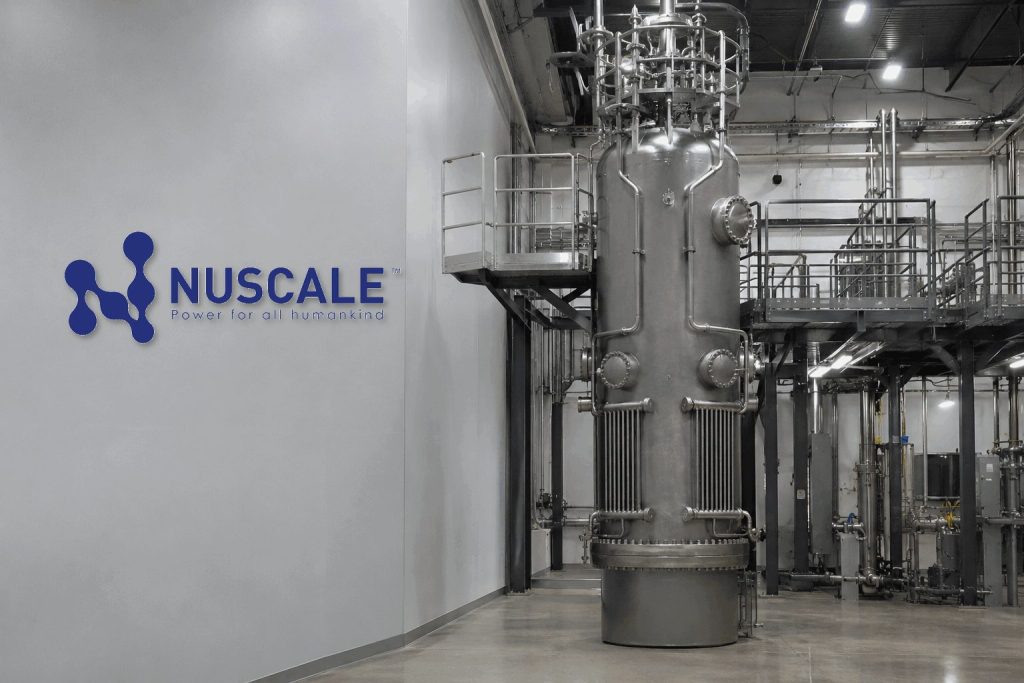
PORTLAND, Oregon, August 30, 2026, 17:00 – Shares of NuScale Power fell 4.6% as markets reacted to the contrast between the company's $4 billion…
·3 min read
NYSE: SMR · STOCK MOVE
NuScale: liquidity versus commercialization
Market: Aug. 28, 2026, 16:00 EDT Financials: Q2 ended June 30, 2026
Friday close
$9.29
−4.62%
Volume
37.8M
112% of 65-day average
Market value
$3.99B
≈$190M erased Friday
Short float
16.9%
67.83M shares
Valuation bridge
Equity value
$3.99B
Cash + investments
$1.90B
TTM net loss
$416M
TTM revenue
$10.7M
Product scale
Peer tape
Company
Friday
Market value
Signal
NuScale
−4.62%
$3.99B
Approved design, pre-commercial
Oklo
−5.64%
$7.07B
Advanced-reactor developer
Nano Nuclear
−6.60%
$0.94B
Microreactor developer
Cameco
−5.94%
$43.47B
Operating fuel supplier
Investor bridge
Cash and investments equal 48% of market value, but the stock still trades near 373 times trailing revenue. Binding customer orders must convert regulatory progress into cash flow.
Next catalyst and risks
Q3 results are scheduled for November 5. Watch TVA and Romanian contract progress, partner financing, quarterly cash use, construction costs and potential dilution.
Sources: NuScale Q2 2026 results; Google Finance and StockAnalysis market data; Barron's analyst data; Reuters macro reporting. Historical figures, not investment advice.