NEW YORK, July 30, 2026, 06:01 EDT — Nasdaq premarket trading was underway. Standard market session to open at 09:30 EDT.
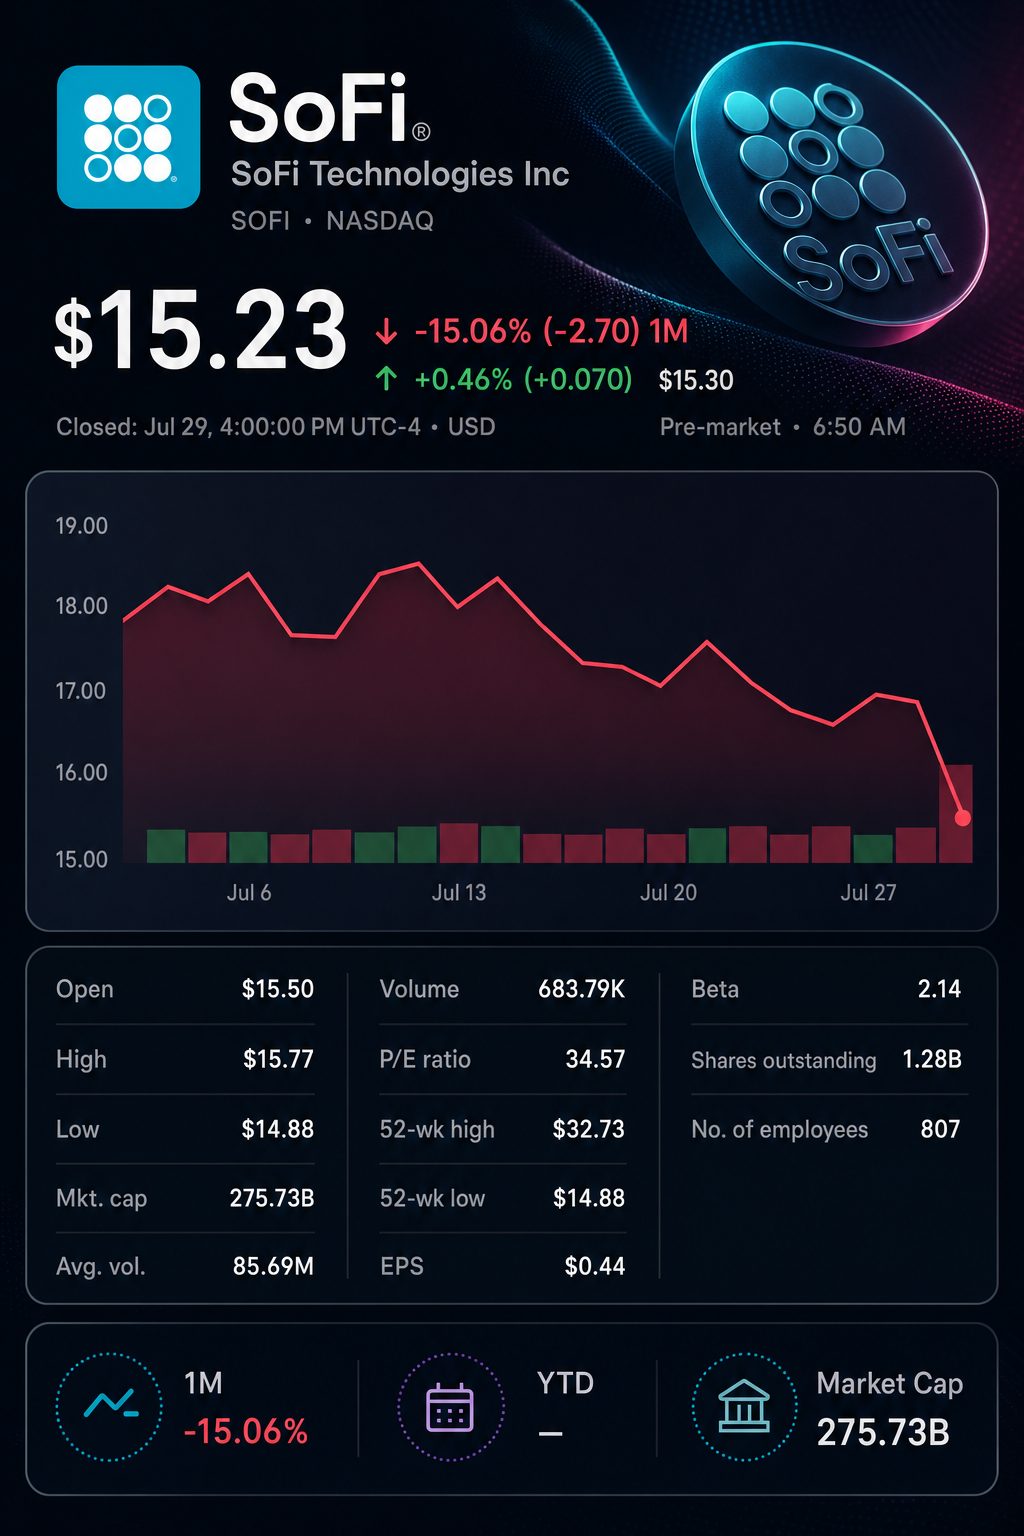
- Shares ended Wednesday at $15.25, falling 8.9%.
- The midpoint for 2026 revenue guidance increased by $145 million, while EBITDA and EPS targets were left unchanged.
- Revenue from the Technology Platform dropped by 23%, whereas Lending revenue increased by 63%.
Shares of SoFi Technologies, Inc. NASDAQ:SOFI fell by $1.49 on Wednesday to end the session at $15.25. The stock’s drop came despite the company reporting record quarterly revenue and raising its full-year sales outlook, as investors shifted their attention to profitability.
The midpoint for July revenue increased by $145 million compared to April. However, adjusted EBITDA was steady at roughly $1.6 billion. Adjusted EPS held at approximately 60 cents.
| 2026 outlook | April 29 guidance | July 29 guidance | Change |
|---|---|---|---|
| Adjusted net revenue | $4.655 billion | $4.75 billion-$4.85 billion | Increase of $95 million to $195 million |
| Adjusted EBITDA | About $1.60 billion | About $1.60 billion | No change |
| Adjusted net income | About $825 million | About $825 million | No change |
| Adjusted EPS | About $0.60 | About $0.60 | No change |
| Implied EBITDA margin | 34.4% | 33.0%-33.7% | Decrease of 0.7-1.4 points |
Company forecast; margins are calculated using non-rounded values.
Initial estimate: The revision does not attribute any additional 2026 EBITDA to the revenue increase. The full-year EBITDA margin drops to 33.3% from 34.4% at the midpoint. This is a factor in the stock’s movement.
Following first-half performance, SoFi needs to achieve approximately $902 million in EBITDA for the second half. Revenue at the midpoint would total about $2.51 billion, reflecting a 36.0% margin compared to 30.4% in the first half.
The company outperformed Wall Street forecasts for the quarter. Adjusted revenue was 7.6% higher than the LSEG consensus. Adjusted earnings per share surpassed expectations by one cent.
| Metric | Q2 2026 | Consensus | Beat | Q2 2025 | Year-on-year |
|---|---|---|---|---|---|
| Adjusted net revenue | $1.206 billion | $1.12 billion | 7.6% | $858.2 million | 40% |
| Adjusted EPS | $0.12 | $0.11 | 9.1% | $0.08 | 50% |
| Adjusted EBITDA | $357.8 million | — | — | $249.1 million | 44% |
| GAAP net income | $156.6 million | — | — | $97.3 million | 61% |
Company data; consensus forecasts gathered by LSEG and published by Reuters.
Chief Executive Anthony Noto stated that “spending remains strong, demand remains strong.” Speaking to Reuters, he said credit performance was in line with or surpassed projections. His remarks reinforce the outlook for loan volumes. Reuters
The composition of revenue was more complicated. Lending accounted for close to 60% of total consolidated GAAP revenue. The Technology Platform contributed just around 7%, marking a decline compared to the previous year.
| Segment | Q2 net revenue | Year-on-year | Contribution margin |
|---|---|---|---|
| Lending | $724.8 million | 63% | 55% |
| Financial Services | $466.3 million | 29% | 46% |
| Technology Platform | $84.5 million | -23% | 14% |
Corporate items and intercompany eliminations prevent segment revenue from adding up exactly to consolidated revenue.
Fee-based revenue totaled $472.3 million, accounting for 39% of overall revenue. The Loan Platform Business contributed $143.3 million, making up approximately 30% of the fee-based segment and still linked to lending operations.
Tim Switzer, analyst at KBW, described the outcome as a “lower-quality beat.” He maintained his underperform rating. Andrew Jeffrey of William Blair reiterated his outperform recommendation, signaling differing views regarding the strength of SoFi’s growth. MarketWatch
Member economics improved. Of all new products, 51% were opened by existing customers. For the first time, SoFi’s product additions outpaced member growth two-to-one.
| Operating indicator | Q2 2025 | Q1 2026 | Q2 2026 |
|---|---|---|---|
| Cross-buy rate | 35% | 43% | 51% |
| Products per member | 1.46 | 1.51 | 1.54 |
| New members | 0.85 million | 1.055 million | 1.1 million |
| New products | 1.26 million | 1.8 million | 2.2 million |
| Personal-loan charge-off rate | 2.83% | 3.03% | 2.62% |
Based on SoFi’s reported year-on-year improvement of 21 basis points.
Funding continued to provide significant support. Deposits climbed by $5.3 billion, reaching $45.5 billion. SoFi projected annualized savings of $712.6 million compared with warehouse funding. Net interest margin increased by four basis points to 5.98%.
The Technology Platform showed an indication of steadying. Revenue climbed 13% compared to the previous quarter. Enabled accounts grew by two million. Despite these gains, both figures remained below last year’s levels following a major client’s departure.
The next evaluation concerns profit conversion. SoFi will need to achieve the anticipated increase in second-half margins and restore growth in its Technology Platform. Doing so would address market worries regarding the quality of its revenue.
Risks: Loan originations increased by 69%, as the default assumption for personal-loan fair value climbed to 4.77% from 4.57%. Any consumer spending slowdown, softening in loan-sale markets, or ongoing platform-client attrition could threaten the second-half margin outlook.
Related articles: NASDAQ:SOFI