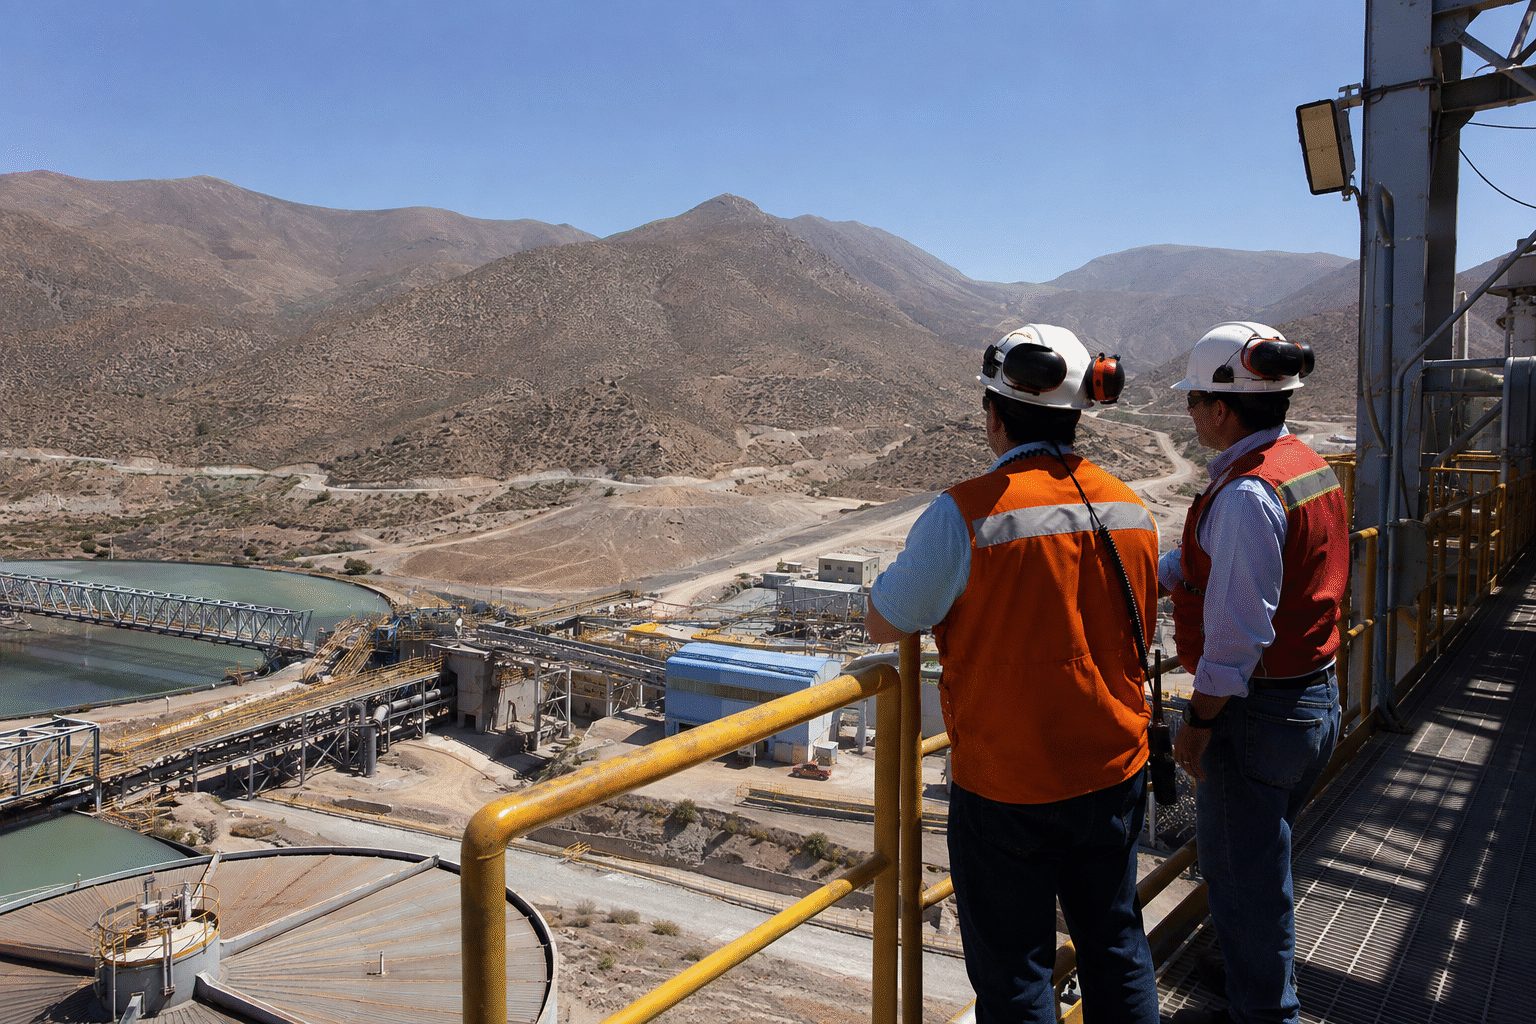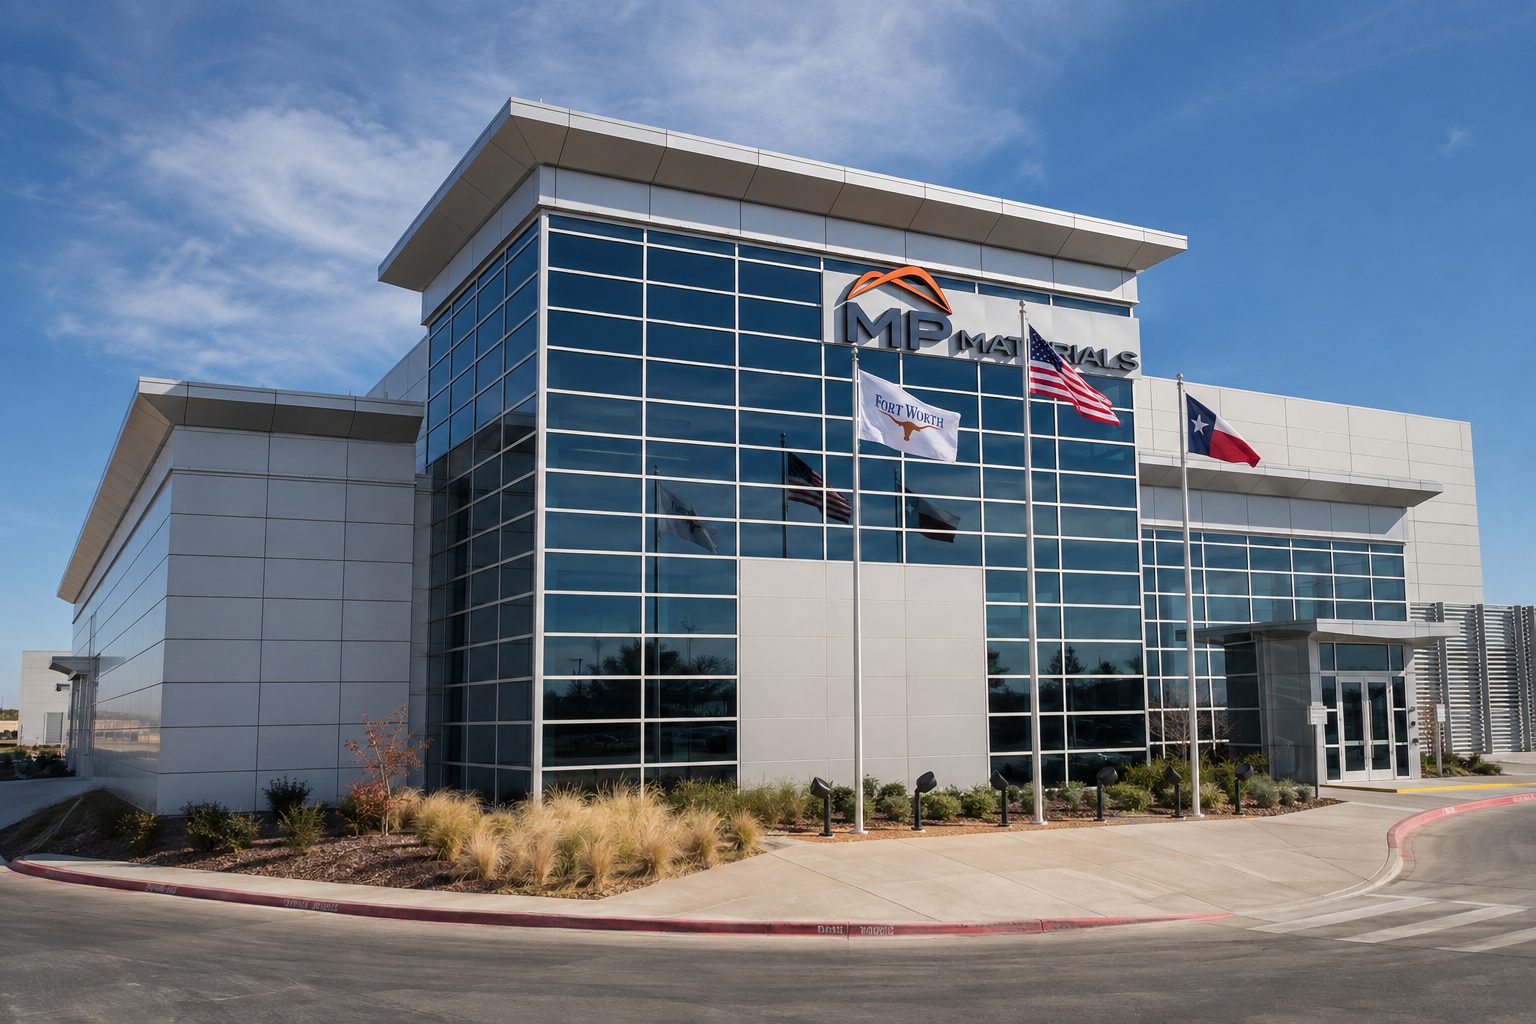

MP Materials Corp. surged 9.14% on Friday, recouping much of its losses from earlier in the week. The stock ended the day at $60.07, close to its session peak of $60.59.
| Q2 metric | 2026 | YoY |
|---|---|---|
| Revenue | $108.5M | +89% |
| Adjusted EBITDA | $28.5M | +$41.0M |
| NdPr production | 840 MT | +41% |
| NdPr sales | 1,006 MT | +127% |
| REO production | 11,072 MT | -16% |
| Measure | Value | Vs. close |
|---|---|---|
| Low target | $58.00 | -3.4% |
| Average target | $75.38 | +25.5% |
| Median target | $75.00 | +24.9% |
| High target | $100.00 | +66.5% |
| Consensus | Strong Buy | 18 analysts |
Friday's 9.14% rebound left MP only 2.26% higher for the week. The operating case is improving, but the earnings bridge remains policy-sensitive: Q2 price-protection income equaled nearly two-thirds of adjusted EBITDA.
Rare-earth trade policy
Independence magnet qualification
10X construction progress
Follow-through after high-volume rally
Sources: Nasdaq market data; MP Materials Q2 2026 results; S&P Global analyst data via StockAnalysis, last updated August 19, 2026. Adjusted EBITDA is non-GAAP. Percentages are calculated from reported figures and may vary slightly due to rounding.
Dogecoin led Bitcoin over the past week, while Coinbase finished Friday 25.6% above its August 14 close. The next signal is turnover: lasting volume can help transaction revenue; a fast price reversal cannot.
| Operating marker | Q2 2026 | Read-through |
|---|---|---|
| Transaction revenue | -21% q/q | Trading softness was visible |
| Trading-volume share | 10.3% | Record; up from 9.1% |
| Subscription/services mix | 48% of net revenue | Buffers fee volatility |
| Adjusted EBITDA | 14th positive quarter | Cost discipline held |
| Buy / Hold / Sell | 22 / 9 / 3 |
|---|---|
| Consensus | Buy |
| Average target | $195.52 · 4.8% above close |
| Median target | $185.00 · 0.8% below close |
| Low / High | $95 / $330 |
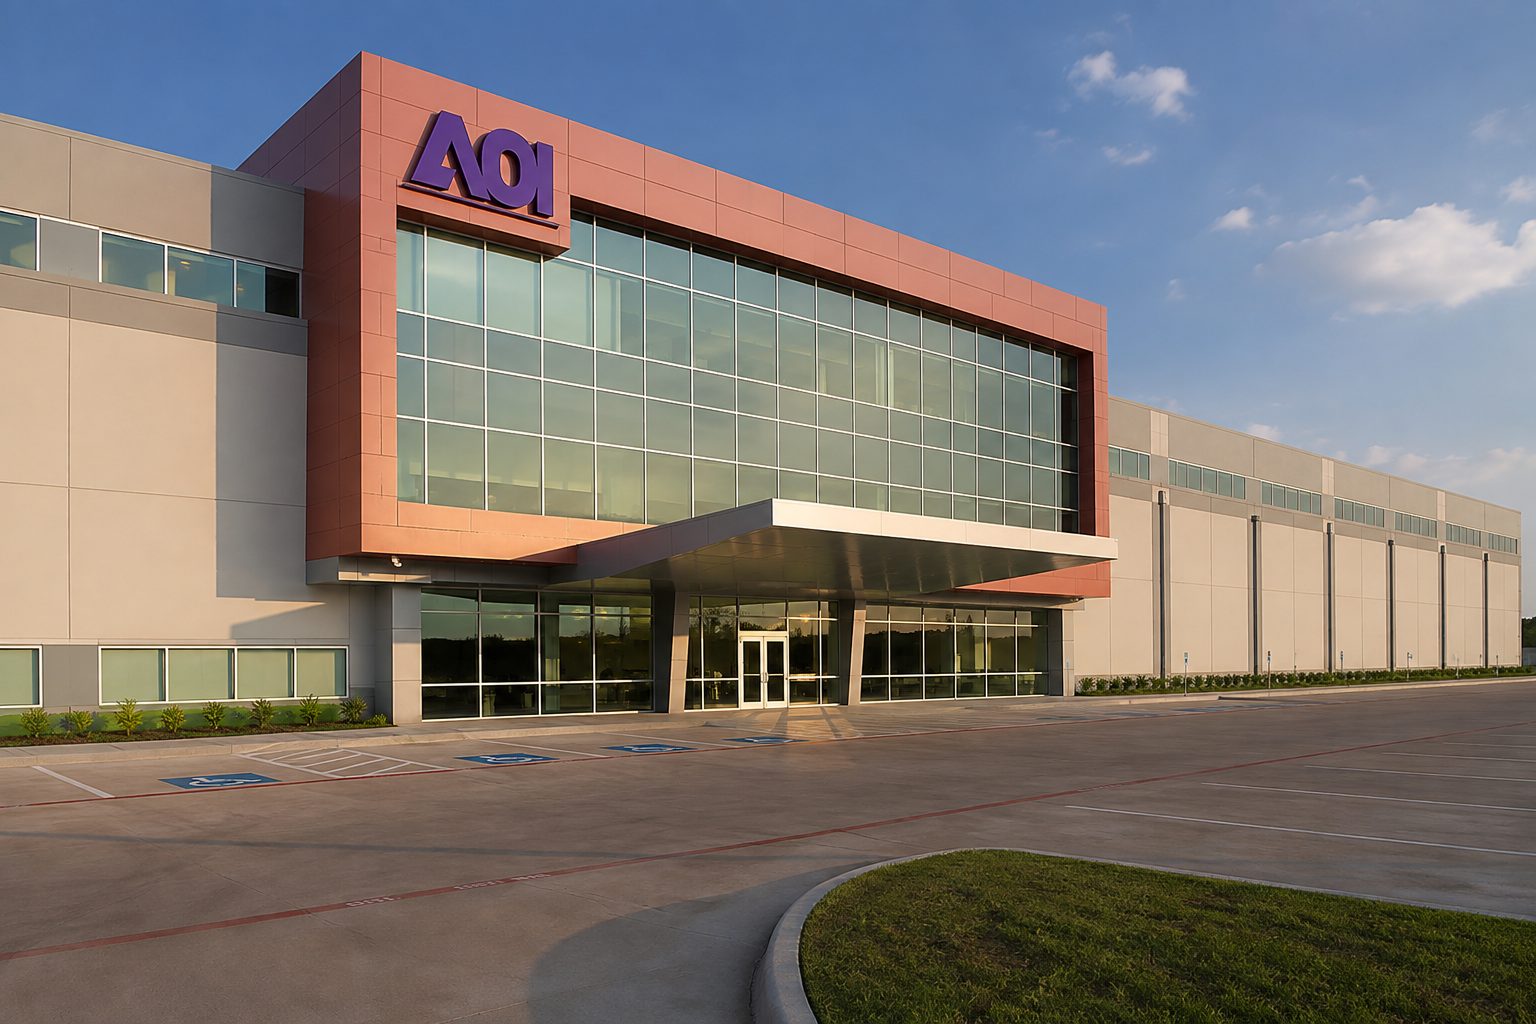
NASDAQ: AAOI · Investor snapshot
Applied Optoelectronics, Inc. · U.S. market closed Friday, August 21, 2026
-3.32% Friday
Closed August 21 at 4:00 p.m. EDT.
-9.83% vs. close
Nasdaq last sale at 6:25 p.m. EDT. Extended-hours prices can be thin.
Raymond James and Needham may sell shares over time. AOI is not required to use it.
2% sales commissionAt Friday's close, equal to 5.7% of the 84.91 million shares outstanding on August 20.
The balance sheet is liquid, but capacity expansion consumes cash quickly. The new authorization is 1.18× June cash plus restricted cash.
Midpoint implies 42.0% sequential growth. Management says demand may exceed capacity through mid-2027.
Consensus: Buy from six analysts. Three were Holds. Targets were last updated before the ATM filing.
The SEC illustration is mechanical, not a forecast. Actual prices and issued shares will vary.
Equity funds the 800G and 1.6T ramp. Q3 revenue reaches or exceeds the $272.5 million midpoint.
AOI sells gradually. Investors weigh added capacity against a persistent supply overhang.
Weak pricing forces more shares into the market while production delays or customer timing slow the ramp.
Sources: August 21 Form 8-K, prospectus supplement, Q2 Form 10-Q, company Q2 release, S&P Global analyst data via StockAnalysis, and Nasdaq market data. Calculations use displayed figures and may differ due to rounding.
Market data as of August 21, 2026, 16:00 EDT
| View | Rating | Target | Upside |
|---|---|---|---|
| Freedom | Hold | $8 | 12.5% |
| S&P consensus | Hold | $13 | 82.8% |
| Cantor | Spec. Buy | $18 | 153.2% |
| Q2 net loss | $9.6M |
| Q2 R&D | $6.3M |
| Cash / share | $0.68 |
| Shares outstanding | 201.9M |
| Share-count growth | +31.9% |
| Revenue | $74.9M |
| Net loss | $177.1M |
| Adjusted EBITDA* | $10.4M |
| Project financing | $7.5B |
| Consolidated debt | $7.6B |
Targeted Serra Verde closing and leadership handoff preparation.
Stillwater targets 600 tonnes annual magnet run rate; Round Top feasibility work due.
Round Top definitive feasibility study targeted for publication.
Blacksburg commissioning and Round Top commercial-production targets.
Headline book value does not flow cleanly to common shareholders.
| Measure | Q2 2026 | Q1 2026 |
|---|---|---|
| Net income | $4.0B | $3.7B |
| Net revenue | $7.6B | $7.3B |
| Credit-loss provision | $485M | $277M |
| Non-interest expense | $2.1B | $2.2B |
| Net worth | $116.5B | $112.5B |
| Firm | View | Target |
|---|---|---|
| B. Riley | Neutral | $7.00 |
| Wedbush | Neutral | $8.00 |
| KBW | Underperform | $8.50 |
| BTIG | Buy | $20.00 |
| 7-analyst aggregate | Hold | $12.25 |
Market open · delayed snapshot
August 21, 2026 · 14:23 EDT (UTC−04:00)
Apple lagged the Nasdaq by 1.06 percentage points.
Tariff refunds added $0.11 per share and about two gross-margin points.
The operating story remains strong. But a 35.57× trailing multiple and only 5.5% to the average target leave little room for a product delay or slower AI uptake.
| Metric | Old | Updated |
|---|---|---|
| Q2 revenue | $12.6M | $13.5M |
| Revenue growth | 116% | 157% |
| GAAP op. loss | $30.6M | $29.9M |
| FY revenue guide | $43.0M | $45.1M |
| 2026 target | 30 logical qubits |
| Illinois system | 2027 deployment |
| Commerce LOI | Up to $100M |
| New headquarters | ~107,000 sq. ft. |
Market data: August 21, 2026, 12:33 p.m. EDT (18:33 CEST), during the U.S. session. USD unless marked CAD.
Estimated equity value added Friday. It equals 99.7% of Denison’s $345 million convertible-note principal. The difference is about $1.02 million.

Four-peer average: +7.83%. DNN outperformance: 4.43 percentage points.
S&P Global average target from 14 analysts, last updated July 13. Implied upside from $3.52: 41.8%.
Canadian actions: RBC Outperform, C$6.00; National Bank Outperform, C$6.50; TD Buy, C$6.50.
Sources: Google Finance, Denison Q2 results, Phoenix construction update, convertible-note terms, and S&P Global consensus via StockAnalysis. Analyst targets are forecasts, not guarantees.
Market snapshot: August 21, 2026, 11:14 EDT
US market open · CNY financial data
| Metric | Latest | YoY | Signal |
|---|---|---|---|
| Group revenue | RMB268.95bn | +9% | Top line held |
| Operating income | RMB15.16bn | −57% | Investment drag |
| Net income | RMB10.44bn | −75% | Sharp contraction |
| Operating margin | 6% | −8 pts | Group leverage weakened |
| Cloud EBITA margin | 12% | Expanded | Unit economics improving |
Sources: Alibaba June-quarter release; Reuters, August 20, 2026; StockAnalysis/S&P Global and CBOE. Market-value loss uses 2.28 billion shares and the $9.14 intraday decline. Cloud prior-period revenue and related ratios are preliminary estimates derived from reported growth.
| Metric | Q2 2026 | Q2 2025 | Change |
|---|---|---|---|
| Revenue | $16.1B | $12.9B | +25% |
| Non-GAAP gross margin | 41.8% | 29.7% | +12.1 pts |
| Non-GAAP operating margin | 17.2% | −3.9% | +21.1 pts |
| Non-GAAP EPS | $0.42 | −$0.10 | Positive |
| Operating cash flow | $7.0B | — | Net raise = 2.8× |
Tempus's two-session rally prices a broader cancer-monitoring opportunity, not merely the pending Personalis acquisition.
The close sits 5.6% above the 15-analyst average. BTIG's new $80 target implies 20.0% upside.
RBC still carries a near-50% one-year gain. The next report must show that credit remains controlled while EPS and revenue rise about 4% from the second quarter.
Average target: C$266.42, 5.9% below the observed price. Published range: C$227–C$320.
RBC releases fiscal third-quarter results.
Management call. Listen for provisions, loan growth, trading revenue and capital returns.
Caroline Mulroney starts as vice chair, focused on major client relationships.
Bottom line: Thursday's drop trims the premium. It does not remove the need for another clean earnings beat.
Today’s highest-ranked model selections.
The catalysts most likely to move markets.
The 9:45 AM ET pair has the strongest broad-market potential today because growth surprises can quickly reprice Treasury yields, the dollar and rate expectations.
Results can influence consumer and retail sentiment, particularly around value-seeking behavior, traffic and gross margins.
Its results are relevant for communications equipment and networking demand, with earnings sensitivity to margins and product mix.