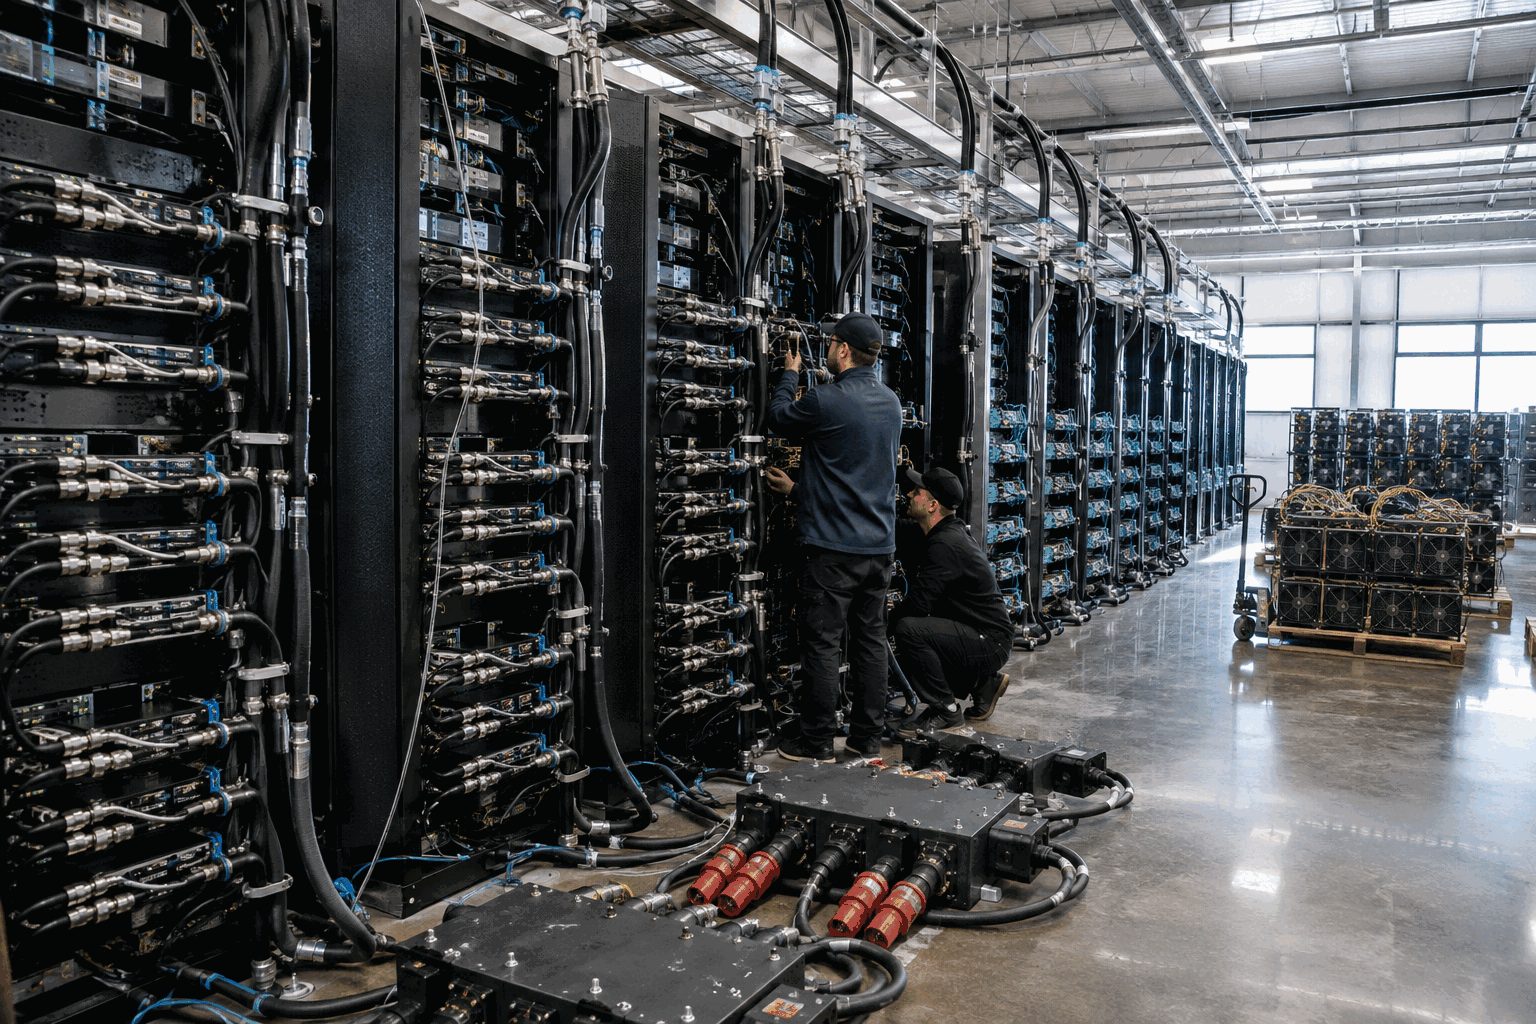
IREN Limited shares declined by 5.75% ahead of the market open on Friday, cutting approximately $833 million from its implied equity valuation.
FY2026 results and premarket reset · Market data at 07:14 EDT, August 28, 2026
ARR is a non-GAAP operating metric. IREN warns recognized revenue may be materially lower. Commissioning and customer acceptance govern conversion.
| US$ millions | Q4 | Q3 | Change |
|---|---|---|---|
| Total revenue | 137.2 | 144.8 | −5.2% |
| AI Cloud | 70.5 | 33.6 | +109.8% |
| Bitcoin mining | 66.7 | 111.2 | −40.0% |
| Adjusted EBITDA | 19.2 | 59.5 | −67.7% |
| Net loss | (684.0) | (247.8) | Wider |
Quarter-end cash and restricted cash: $7.62B.
Q4 operating cash flow: $1.81B, including a $1.72B increase in deferred revenue.
Deferred revenue supports cash flow before revenue recognition. It also creates delivery obligations.
The market is weighing a fast mix shift against its accounting cost. AI Cloud more than doubled sequentially, but adjusted EBITDA fell 68% and the quarter carried a $450.4M mining-hardware impairment.
The key question is no longer demand alone. It is how quickly contracted ARR becomes recognized revenue without further impairments, delays or financing strain.
52-week range
$25.31–$76.87
Short interest
30.61% of float
Three-month return
−36.21%
One-year return
+53.06%
| 2026 IT capacity target | 0.3 GW |
| 2027 IT capacity target | 0.8 GW |
| Horizon 1 | Accepted by Microsoft |
| Recent contract economics | >$20M revenue/MW |
| Claimed payback | ~2 years |
Commissioning delaysCustomer concentrationGPU supplyHardware obsolescenceDebt costBitcoin exposure
The $4B contracted ARR figure is not recognized revenue. Timing, utilization, uptime and customer acceptance remain decisive.
Sources: IREN FY2026 results; MarketWatch quote and ownership data; Investors.com market report. Financial figures in U.S. dollars. Calculations may differ due to rounding.
Management lifted fiscal 2027 guidance by about $500 million and fiscal 2028 guidance by about $1.5 billion.
| Metric | Q2 FY27 | Signal |
|---|---|---|
| Revenue | $2.739B | +37% |
| Adjusted EPS | $0.94 | $0.93 est. |
| GAAP net income | $308M | +58% |
| Operating cash flow | $605.5M | 22.1% margin |
| Non-GAAP gross margin | 58.9% | Profitable scale |
| Signal | Current view | Investor meaning |
|---|---|---|
| Q3 revenue | $3.15B ±5% | More than 50% growth implied |
| Q3 adjusted EPS | $1.10 ±$0.05 | Above Q2 run-rate |
| Google contribution | Some through FY28 | Larger in FY29 |
| Investor Day | Oct. 6, 2026 | Next major detail point |
The median target offers roughly 22% upside from premarket. Forward P/E is 58.4×, versus 32.2× for Broadcom.
NFL distribution is secured; unit economics remain the real contest.
Volume and users expanded, but game outcomes and promotions compressed monetization.
The renewal preserved distribution but did not reverse the de-rating.
| Signal | DraftKings | FanDuel parent Flutter | What matters |
|---|---|---|---|
| Q2 revenue | $1.443B, −5% | $4.326B, +3% groupwide | Growth quality diverged |
| Activity | $13.1B sports volume, +15% | FanDuel retains NFL sportsbook status | Access is broad; conversion decides value |
| Profit signal | FY26 EBITDA guide $700M–$900M | Q2 adjusted EBITDA $508M, −45% | Promotions and taxes pressure margins |
| Market close | $24.22, −2.3% | $95.01, −3.1% | Investors remain cautious |
DraftKings and FanDuel retain promotion, real-time statistics, event presence and NFL digital integrations. DraftKings also keeps daily fantasy status. Fanatics joins as a third sportsbook partner and gains online-casino marketing rights.
Positive: payer retention and cross-sell. Negative: customer-friendly results or higher acquisition costs.
Potential contract scale meets extreme liquidity and execution risk.
| Measure | USD | Relative scale |
|---|---|---|
| Five-year purchase estimate | >$300M | |
| Closing market value | $60.8M | |
| 2025 revenue | $26.6M | |
| Year-end cash | $6.2M |
The $300M figure is a partner projection, not committed revenue.
Revenue fell 51%; the net loss widened 58%.
Florham Park, New Jersey
9 Grade C + 6 Grade D
projected, not guaranteed
Named products remain unlicensed.
| Signal | Bull case | Risk case |
|---|---|---|
| Commercial conversion | Signed minimum purchases | Forecast remains nonbinding |
| Liquidity | Upfront payments fund scale-up | Equity issuance dilutes holders |
| Manufacturing | Validated lots and release criteria | Qualification delays or batch variability |
| Regulatory | Clear development pathway | No FDA approval for named products |
Sources: Celularity/MuseCell Business Wire release, Aug. 27, 2026; Celularity 2025 Form 10-K; Public/Xignite closing market data. Figures are historical or issuer projections, not investment advice.
Nvidia's forecast lifted Intel 4.36%; the close remains below Intel's recent $95 share-sale price.
| Company | Close | Move | Volume | Trailing P/E |
|---|---|---|---|---|
| Intel | $92.09 | +4.36% | 100.56M | N/M |
| Nvidia | $227.98 | +8.72% | 298.91M | 28.6× |
| AMD | $476.67 | −0.86% | 16.44M | 122.5× |
| Micron | $935.39 | −0.36% | 28.84M | 21.2× |
The split tape matters: Thursday rewarded Intel's AI exposure, but the whole semiconductor group did not rally.
| Q2 revenue | $16.1B | +25% |
| GAAP gross margin | 40.4% | +12.9 pts |
| GAAP operating margin | 11.1% | +35.8 pts |
| Non-GAAP net income | $2.2B | vs. loss |
| GAAP net result | −$11.0B | loss |
Revenue and margins rose sharply, but the GAAP loss kept earnings quality in focus.
Intel sold 210.5 million shares at $95, creating a clear dilution and execution benchmark.
Nvidia's forecast lifted Intel, yet no new Intel design win was announced.
Intel's 4.36% gain says the market sees value in its exposure to expanding AI budgets. The harder test is conversion: foundry utilization, server share, margin durability and cash generation must justify both a $470 billion valuation and the new capital raised at $95.
Risks: sector enthusiasm can reverse; Nvidia demand does not guarantee Intel revenue; foundry spending and execution delays remain material. Analyst consensus: Hold from 48 analysts; average target $114.88. Sources: Intel, Reuters, Google Finance market data and StockAnalysis.
Settlement snapshot for August 27, 2026. Updated at 21:06 EDT / August 28, 03:06 CEST.
Brent settled 5.5% above EIA's third-quarter average and 15.0% above its fourth-quarter forecast.
| Commercial crude stocks | 428.9M bbl 1% above five-year average |
| Weekly crude change | +0.1M bbl |
| Gasoline stocks | −2.5M bbl 6% below five-year average |
| Refinery utilization | 97.4% |
| Refinery inputs | 17.4M b/d |
| Channel | Signal |
|---|---|
| Inflation | Upward Higher crude lifts refined-product and freight costs. |
| Airlines & transport | Margin risk Fuel hedges determine near-term sensitivity. |
| Producers | Cash-flow support WTI above $80 strengthens upstream economics. |
| Refiners | Mixed Feedstock rises while gasoline stocks remain tight. |
| Scenario | Price pressure | Evidence to watch |
|---|---|---|
| Verified Hormuz corridor | Downward | Higher tanker counts, lower freight and insurance rates. |
| Diplomacy remains stalled | Premium persists | Brent–WTI spread holds above $6. |
| Further military escalation | Sharp upside risk | Supply outages, shipping delays and wider refined-product cracks. |
| Demand disappoints | Offsets risk premium | Inventory builds and weaker refinery runs. |
Cost controls and a 15% workforce reduction lifted the earnings outlook. Revenue grew just 0.8%, leaving shares almost unchanged after hours.
Q2 FY2027Reported Aug. 27, 2026The margin expansion is the dominant signal. Customer and recurring-revenue growth remain modest.
| Metric | New | Prior | Midpoint change |
|---|---|---|---|
| FY revenue | $491.5M–$496.5M | $488.5M–$496.5M | +0.3% |
| FY adj. EPS | $1.33–$1.37 | $1.27–$1.32 | +4.2% |
| Q3 revenue | $123M–$125M | — | New |
| Q3 adj. margin | 26.5%–27.5% | — | New |
Bull case: The restructuring protects cash generation and supports a higher EPS range. Q2 beat revenue guidance, and free cash flow improved.
Bear case: ARR grew only 0.4% and retention stayed below 100%. The stock already trades above the average analyst target.
Watch next: Q3 revenue of $123M–$125M, adjusted margin of 26.5%–27.5%, retention and the pace of restructuring charges.
The fundamentals beat estimates, but not elevated AI expectations. Q3 revenue guidance exceeded consensus by about 4%, while the non-GAAP gross-margin midpoint falls 90 basis points sequentially.
| Metric | Q2 FY26 | Q2 FY27 | YoY |
|---|---|---|---|
| Revenue | $2.006B | $2.739B | +36.5% |
| GAAP operating income | $290.1M | $459.7M | +58.5% |
| GAAP gross margin | 50.4% | 53.1% | +270 bp |
| Operating cash flow | — | $605.5M | — |
| Metric | Guide midpoint | Consensus | Premium |
|---|---|---|---|
| Revenue | $3.15B | $3.03B | +4.0% |
| Adjusted EPS | $1.10 | $1.07 | +2.8% |
| Non-GAAP gross margin | 58.0% | — | −90 bp QoQ |
Revenue midpoint implies roughly 15% sequential growth.
Watch: custom-silicon ramps, optical demand, customer concentration, supply, gross-margin conversion and cash returns.
| Operating ARR | $1.0B |
| Contracted 2026 ARR | $4.0B |
| 2026 IT capacity | ~0.3GW |
| 2027 IT capacity target | ~0.8GW |
| Recent revenue / MW | >$20M |
| Customer prepayments | 45–55% GPU capex |
| Metric | FY25 | FY26 | Change |
|---|---|---|---|
| Total revenue | $501.0M | $707.0M | +41.1% |
| AI Cloud revenue | $16.4M | $128.8M | +685% |
| Adjusted EBITDA | $269.7M | $245.7M | -8.9% |
| Net income/(loss) | $86.9M | -$702.6M | NM |
| Regular close | $40.53 |
| After-hours | $38.11 |
| Implied value change | ~-$865M |
| 52-week range | $22.63–$76.87 |
| Ratings | 7 Buy / 2 Hold / 1 Sell |
| Average target | $77.44 |
Watch: quarterly adjusted EBITDA fell 67.7% sequentially as staffing and platform costs arrived before the revenue ramp. Deferred revenue drove $1.722 billion of quarterly operating cash flow.
Market snapshot: August 27, 2026, 17:30 EDT · Quarter ended July 31
Bar lengths are normalized within each comparison, not a common scale.
| Metric | Current | Investor signal |
|---|---|---|
| Q3 subscription revenue | ~$2.515B | Broadly in line |
| FY subscription revenue | $9.94–$9.95B | Tiny midpoint raise |
| New buyback authorization | $4.0B | ~9% of AH value |
| After-hours value loss | ~$3.3B | 7.02% move |
| Consensus | Outperform |
| Analysts | 41 |
| Average target | $188.21 |
| Median target | $202.00 |
| Target range | $92–$275 |
| Upside to average | 4.6% |
Watch enterprise IT budgets, large-deal timing, AI pricing, Financials adoption and acquisition speculation. Extended-hours liquidity can amplify the move.
| Metric | Q2 FY27 | Q2 FY26 | Change |
|---|---|---|---|
| Revenue | $427.3M | $309.9M | +38% |
| Subscription ARR margin | 14.0% | 9.4% | +4.6 pp |
| Non-GAAP gross margin | 81.0% | 81.6% | −0.6 pp |
| Free cash flow | $65.7M | $57.5M | +14% |
| FCF margin | 15% | 19% | −4 pp |
| Metric | Prior range | New range | Midpoint lift |
|---|---|---|---|
| Revenue | $1.638B–$1.648B | $1.685B–$1.693B | +$46M |
| Subscription ARR | $1.854B–$1.862B | $1.880B–$1.885B | +$24.5M |
| Free cash flow | $293M–$303M | $323M–$333M | +$30M |
| Adjusted EPS | $0.25–$0.35 | $0.47–$0.53 | +$0.20 |
3,084 large customers+23% YoY$1.75B liquidity
Extended-hours liquidity can distort price discovery. Rubrik remains GAAP-loss-making. Non-GAAP gross margin slipped 0.6 point, free-cash-flow margin fell four points, and a record-high setup leaves little room for execution misses.
Sources: Rubrik/Business Wire results, Rubrik prior guidance, Public after-hours data, WSJ market data and Yahoo Finance analyst data. Figures are company-reported unless otherwise stated.
Midpoints: revenue $1.200B → $1.2045B; operating income $120M → $126M; EPS $0.35 → $0.31; share count 350M → 361M.
38 ratings aggregated by Robinhood. Ratings are not investment advice.
| Registry field | Before | Aug. 26 update |
|---|---|---|
| Site footprint | Original site set | Baylor College of Medicine added |
| Recruitment | Not yet recruiting | Unchanged |
| Enrollment | 20 | Unchanged |
| Estimated start | Jul. 31, 2026 | Aug. 31, 2026 |
| Primary/final completion | Mar. 31, 2027 | Aug. 31, 2027 |
| Path | Confirmation signal | What would challenge it |
|---|---|---|
| Bull | Recruitment begins; FDA pathway gains clarity; short covering persists | Further trial slippage or weak dosing demand |
| Base | Registry edit stays procedural; shares consolidate into the next data event | Company-specific disclosure changes the evidence set |
| Bear | Delay and safety concerns dominate; squeeze fades | Fast activation plus credible label-expansion progress |
| Metric | Latest | Signal |
|---|---|---|
| Q1 FY2027 bookings | $1.39B | −3% year on year; slightly above guidance |
| Recurrent consumer spending | 84% of bookings | −1% year on year |
| FY2026 bookings | $6.72B | Baseline before GTA VI launch year |
| GTA V installed base | >230M units | Proof of franchise durability |
| GTA VI pre-orders | “Unprecedented” | Management description; not yet recognized sales |
Search attention and the showcase are strong. The stock still fell 2.12%, suggesting investors want execution evidence, not another anticipation cycle.
At $228.50, the market discounts roughly 30% upside to the analyst target. That spread also embeds delay, launch-quality and mobile-performance risk.
The collection directly enters Xbox hardware revenue at a 12.5% premium to the standard 1TB Series X. A sellout would support pricing power and average selling price, but even an aggressive 250,000-unit scenario produces about $225 million of gross sales—only 1.7% of one recent More Personal Computing quarter.
Watch: production volume, sell-through speed, channel inventory, discounting before November 13 and any hardware-margin disclosure. Scarcity can create a sellout without proving mass-market demand. The 1.5% MSFT gain occurred during a broad technology rally and should not be attributed to Xbox alone.
The common stock added roughly $5.2 billion of quoted value. The bitcoin reserve gained about $1.9 billion at the same snapshot.
Before debt, preferred equity, tax and other claims.
| Measure | Reading | Why it matters |
|---|---|---|
| BTC acquisition cost | $63.36B / $75,385 each | Current token price sits 6.6% higher |
| USD Reserve | $5.10B | Supports dividends and interest |
| USD Cash | $1.59B | Flexible treasury deployment |
| Q2 long-term debt | $6.7B | Down 18% in the quarter |
| Q2 preferred equity | $14.4B | Senior claim to common stock |
| Q2 software revenue | $122.4M | Up 6.9% year over year |
| Action, Aug. 17–23 | Amount | Investor interpretation |
|---|---|---|
| MSTR shares sold | 18.26M | Common-stock dilution |
| Net proceeds | $2.0065B | About $109.88 per share |
| STRC repurchase | $136.4M | Reduces preferred claim |
| USD Reserve increase | $300M | Extends obligation coverage |
| Bitcoin traded | None | 840,447 BTC unchanged |
MSTR’s daily gain materially exceeded bitcoin’s. That leverage can reverse. Common issuance, preferred dividends, debt service, tax changes, regulation and contraction of the equity multiple can outweigh a stable token price.
Primary data: Strategy Aug. 24 Form 8-K and Q2 2026 results. Market data timestamped above.
Salesforce market data at 10:28 EDT; operating metrics released Aug. 26.
| Company | Price | Move |
|---|---|---|
| ServiceNow (NOW) | $137.16 | +9.03% |
| Salesforce (CRM) | $248.29 | +20.75% |
| Workday (WDAY) | $197.39 | +3.48% |
| Oracle (ORCL) | $150.84 | +1.32% |
NOW at 10:37 EDT; peer prices at about 10:28 EDT on Aug. 27, 2026.
2:40 p.m. EDT today
ServiceNow CFO Gina Mastantuono speaks at Deutsche Bank's technology conference.
Next quarter
Watch whether cRPO holds near 20% constant-currency growth and AI ACV converts into subscriptions.
Risk
The rally is a peer read-through. Average target upside is now only 3.7%.
The U.S. search phrase “now stock” also points to ServiceNow's expanded Tech Mahindra partnership. It was announced Aug. 20, not today. Tech Mahindra says its ServiceNow deployment handles more than 100,000 monthly cases across 90 countries, supports 150,000 employees and has optimized about 25% of first-level support work.
The AI-memory read-through remains strong. Price action says investors still want Micron-specific proof on HBM volume, pricing and margins.
August 27 value is intraday at 09:39 EDT; earlier values are official closes. The stock opened at $967.01 before fading.
| Metric | Current / latest | Comparison | Investor reading |
|---|---|---|---|
| Fiscal Q3 revenue | $41.46B | $23.86B prior quarter | +73.8% sequential |
| Operating cash flow | $25.39B | $11.90B prior quarter | Cash conversion strengthened |
| Adjusted free cash flow | $18.3B | $7.1B capex | Funds expansion internally |
| Adjusted gross margin | 84.9% | 74.9% prior quarter | Exceptional, hard to sustain |
| Forward P/E | 6.5× | 21.2× trailing | Large earnings-cycle assumption |
| Net cash | $23.75B | $21.03 per share | Balance-sheet cushion |
HBM is stacked memory placed beside AI accelerators. Higher accelerator shipments increase the addressable memory content, but Micron’s realized revenue still depends on qualification, allocation, pricing and yield.
| Reference | Target / value | Upside from $943.46 | Implied FY2027 P/E |
|---|---|---|---|
| Current price | $943.46 | — | 6.1× |
| BMO / Mizuho | $1,300 | 37.8% | 8.4× |
| Analyst average | $1,515 | 60.6% | 9.8× |
| Analyst low | $361 | −61.7% | 2.3× |
| Analyst high | $2,200 | +133.2% | 14.2× |
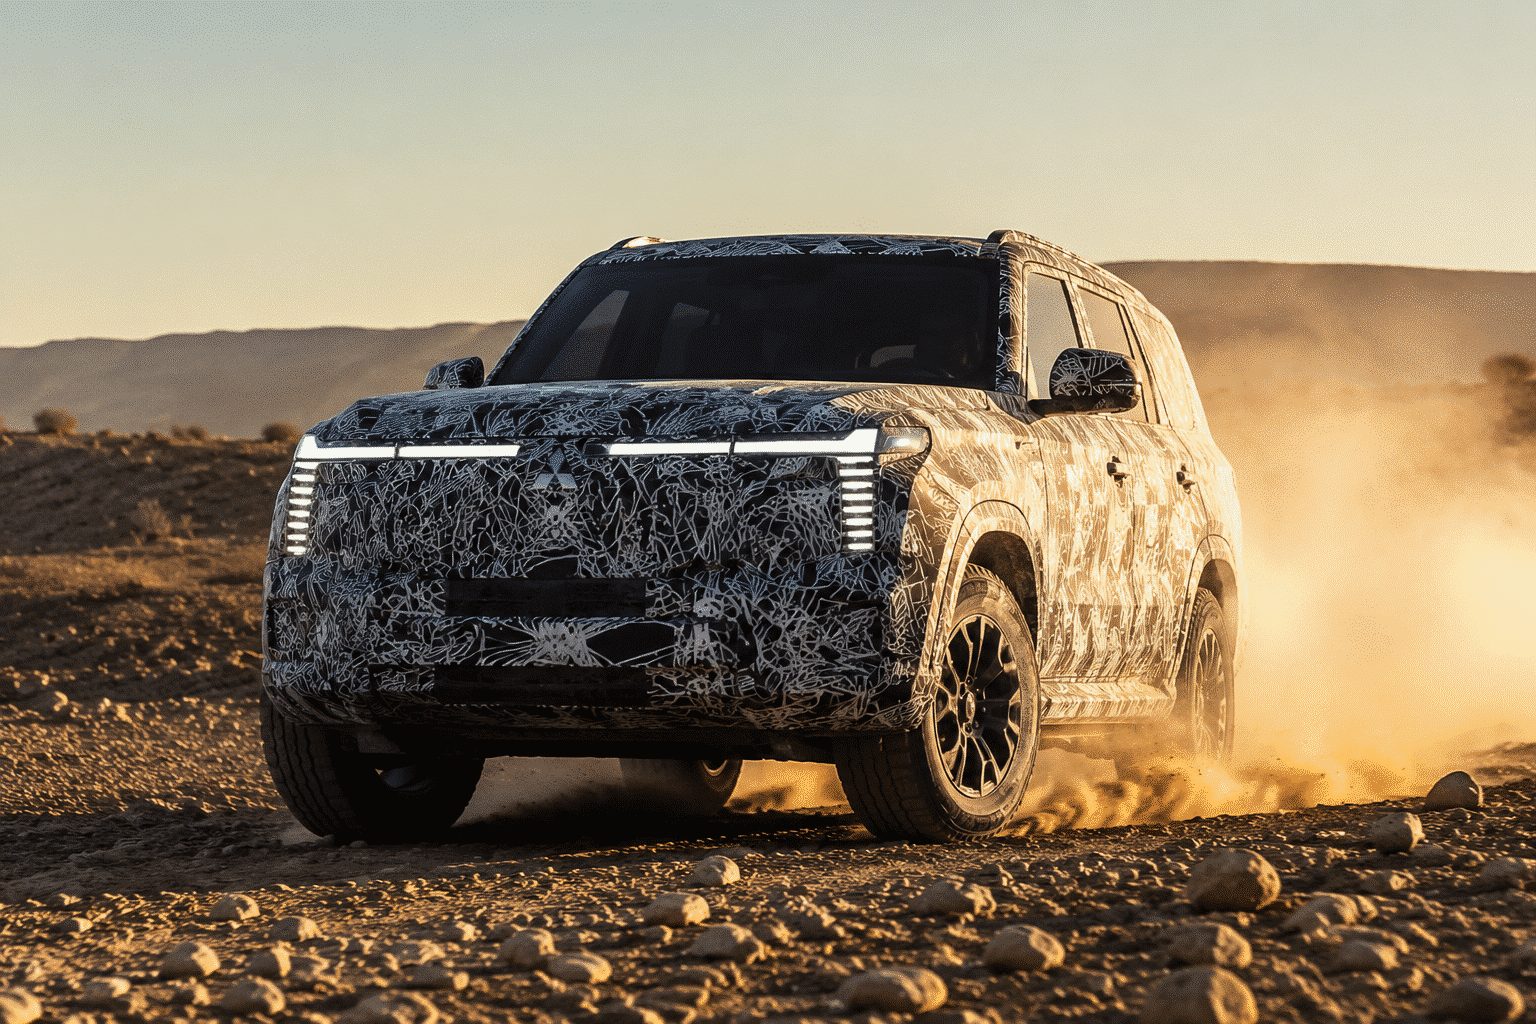
Flagship SUV return meets a low-margin growth plan.
Market data: August 26, 2026, 15:30 JST · Dashboard: August 27, 2026, 03:42 JST
Equity-value change uses the ¥9.20 share gain and 1.34 billion shares outstanding.
| Signal | Verified measure |
|---|---|
| Global return | After 5 years |
| Lifetime sales | >3.25M units |
| Historical markets | >170 |
| Dakar record | 12 wins |
| Platform | Triton ladder frame |
| Drive control | S-AWC |
Lifetime Pajero sales equal 3.8 times Mitsubishi's current full-year volume target.
Reveal date and triple multi meter confirmed.
Pricing, powertrain and initial markets are key.
Management links Pajero to sales growth.
857,000 retail units and 2.8% margin.
Sources: Mitsubishi Motors official Pajero site and releases; Mitsubishi Motors Q1 presentation summary; StockAnalysis and Investing.com market and consensus data. Currency is Japanese yen. Estimates are explicitly marked.
Today’s highest-ranked model selections.
The catalysts most likely to move markets.
Policy tone can move rates, USD, equities, gold and crypto simultaneously.
A weak final reading or elevated inflation expectations could pressure risk assets.
A surprise versus 58.0 may alter the near-term manufacturing-growth narrative.