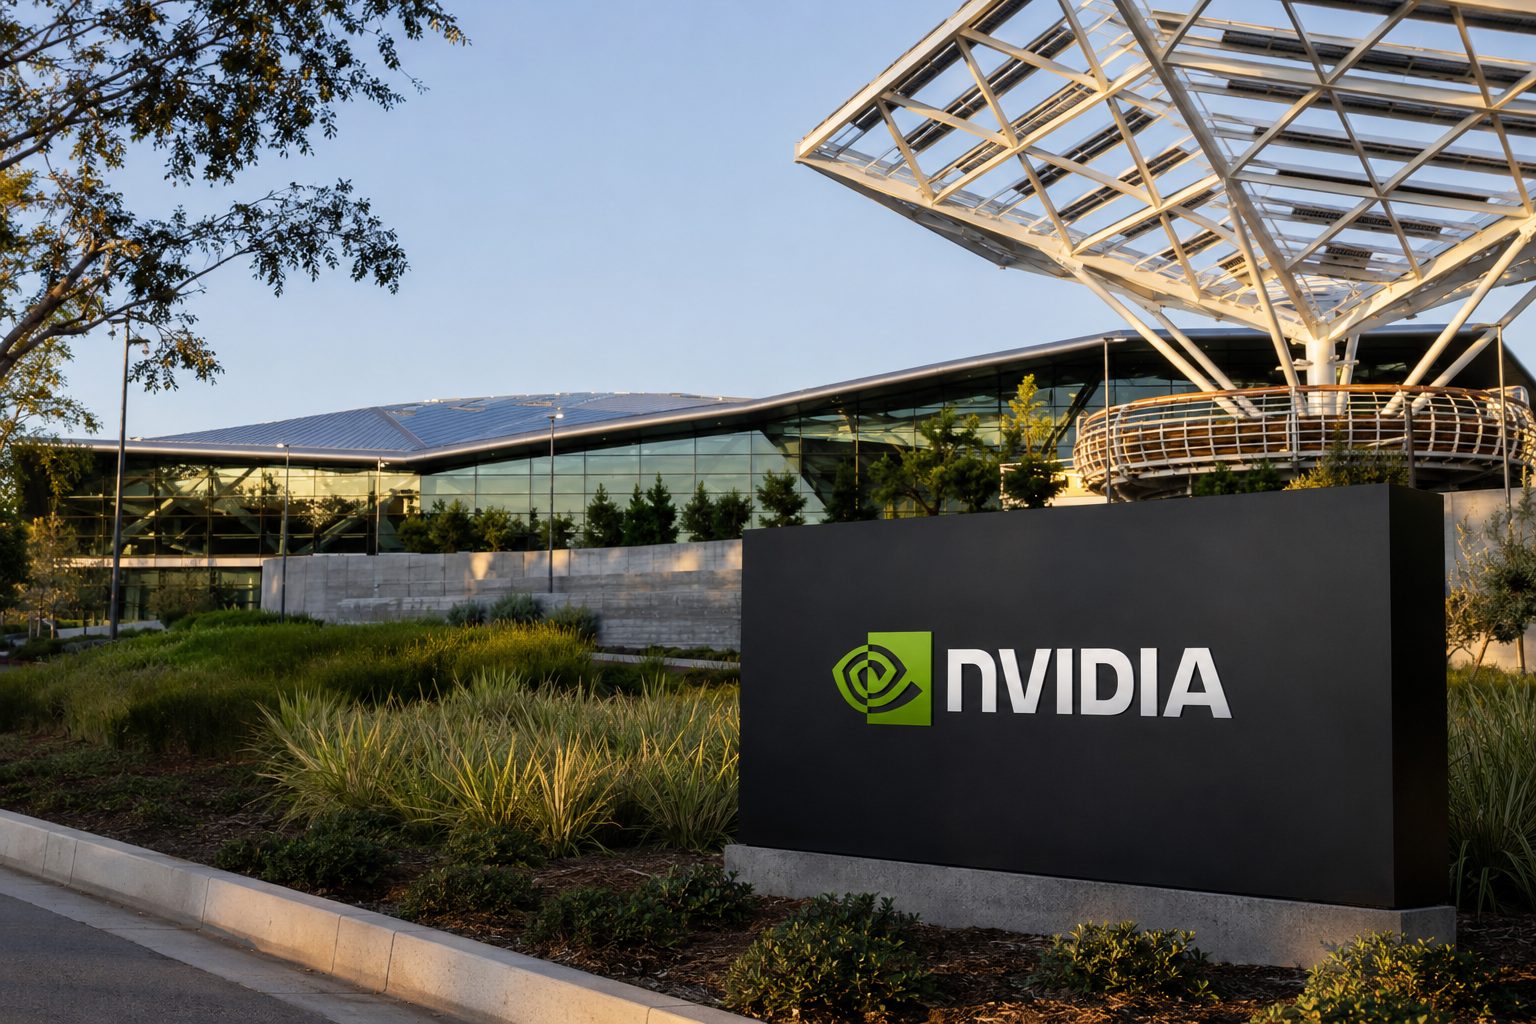

NVIDIA Corporation approaches earnings week with options implying a possible single-day market-value movement of almost $313 billion. This figure surpasses the market capitalization of many S&P 500 firms.
| Revenue test | Value |
|---|---|
| Q1 FY27 actual | $81.62B |
| Q2 guide midpoint | $91.00B |
| Q2 consensus | $92.16B |
| Street premium to guide | +1.27% |
| Expected adjusted EPS | $2.09 |
| Firm | Rating | Target | Upside |
|---|---|---|---|
| BMO Capital | Outperform | $340 | 58% |
| Benchmark | Buy | $335 | 56% |
| Oppenheimer | Buy | $265 | 23% |
| Consensus | Strong Buy | $304.73 | 42% |
| Metric | 2026 | Comparison |
|---|---|---|
| Cash & securities | $237.9m | −$80.2m in H1 |
| Q2 operating expense | $42.9m | +55.0% YoY |
| Q2 net loss | $40.7m | +57.2% YoY |
| Runway at H1 loss pace | ~19 months | Preliminary |
| Firm | Action | Rating | Target | Versus $6.29 |
|---|---|---|---|---|
| Cantor Fitzgerald | Upgrade | Buy | $28 | +345% |
| Piper Sandler | Maintain | Hold | $2 | −68% |
| B. Riley | Maintain | Hold | $5 | −21% |
| Consensus | — | Hold | $10.50 avg. | +67% |
| Median | — | — | $6 | −5% |
Down 3% year on year. Recurrent consumer spending was 84% of bookings. GAAP revenue rose 2% to $1.53bn.
The company also guides to GAAP revenue of $7.9bn–$8.1bn and capital spending near $290m.
Further leaks, a weak reveal, cancellations, launch slippage or soft mobile bookings could challenge the bullish target range.
| Target | Price | Move from close |
|---|---|---|
| Low | $215 | -30.5% |
| Average | $326.34 | +5.5% |
| Median | $335 | +8.3% |
| High | $400 | +29.3% |
| What to watch | Verified baseline | Bull case | Risk |
|---|---|---|---|
| September product event | First-half September timing is reported, not official | Pro-first mix lifts average price | Delay or weaker premium demand |
| iPhone momentum | Q3 revenue +21.7% year over year | Upgrade cycle extends | Lower-priced models arrive later |
| Gross margin | 50.1%; about 2 points from tariff refunds | Mix offsets component costs | Underlying margin nearer 48.1% by simple subtraction |
| Street valuation | $326.34 average target | High target reaches $400 | Low target is $215 |
Market data: August 21, 2026, 4:00 p.m. EDT · U.S. market closed
Preliminary calculation from the August 18 high, August 20 low and Friday close. Price movement has multiple causes.
| Event | Date |
|---|---|
| Reported subpoenas filed | Aug. 20 |
| Official GTA VI extended look | Aug. 27 |
| Requested subpoena response | Sept. 4 |
| GTA VI launch | Nov. 19 |
The August 27 stream starts at 3 p.m. EDT on Netflix and 9 p.m. EDT on Rockstar channels.
| Measure | Value | Gap |
|---|---|---|
| Company low | $8.0bn | −9.7% |
| Company midpoint | $8.1bn | −8.6% |
| Company high | $8.2bn | −7.4% |
| Street estimate cited by Reuters | $8.86bn | Reference |
Guidance is unchanged despite unusually strong preorder demand.
| Firm | View | Target | Upside |
|---|---|---|---|
| BTIG | Buy | $313 | 30.6% |
| J.P. Morgan | Buy | $310 | 29.4% |
| Roth Capital | Buy | $300 | 25.2% |
| Wolfe Research | Buy | $289 | 20.6% |
| 28-analyst average | Strong Buy | $286.89 | 19.7% |
Risks: Rockstar has not fully authenticated the leaked material. Legal outcomes remain uncertain. GTA VI could face delays, weak preorder conversion, higher launch costs or softer engagement. Market-value estimates use an implied share count.
| Reference | Amount | ATM multiple |
|---|---|---|
| Cash + restricted cash | $508.8M | 1.18× |
| Q3 revenue midpoint | $272.5M | 2.20× |
| H1 capex | $335.1M | 1.79× |
| H1 investing cash use | $633.7M | 0.95× |
| Q2 actual | $191.9M |
| Q3 low | $255.0M |
| Q3 midpoint | $272.5M |
| Q3 high | $290.0M |
| Sale price | New shares | Dilution |
|---|---|---|
| $129.10 | 4.65M | 5.47% |
| $124.82 | 4.81M | 5.66% |
| $112.56 | 5.33M | 6.28% |
| Low target | $109 |
| Average | $163.40 |
| Median | $178 |
| High | $220 |
SELLAS' rally now rests on an event-driven Phase 3 survival readout. Cash is meaningful, but it explains only 4.4% of market value.
SLS gained 54.4% across three consecutive winning weeks.
What Friday's equity value represents
No product revenue was reported for the first half of 2026.
REGAL is event-driven; the date cannot be fixed.
Statistically significant, clinically meaningful survival could support a potential BLA filing.
A missed survival endpoint would remove the main late-stage pillar beneath valuation.
Six months ended June 30, 2026
Weekly stock moves use August 14–21 closes. Targets are current S&P Global consensus data.
| Company | Weekly move | Consensus | Analysts | Average target | Implied return |
|---|---|---|---|---|---|
| Moderna · NASDAQ:MRNA | +129.2% | Hold | 23 | $91.39 | -37.0% |
| SELLAS · NASDAQ:SLS | +21.0% | Buy | 2 | $32.50 | +110.2% |
| Merck · NYSE:MRK | +12.3% | Buy | 28 | $147.77 | -3.1% |
| ImmunityBio · NASDAQ:IBRX | +2.9% | Strong Buy | 4 | $12.75 | +63.7% |
REGAL could miss its survival endpoint or face regulatory demands for more evidence. SLS009 remains early. Warrant exercises and future equity sales can dilute holders. A reversal in cancer-vaccine sentiment could erase gains before company-specific data arrive.
Stock data: August 21, 2026, 4:00 p.m. EDT. Dashboard status: August 22, 2026, 6:24 a.m. EDT. Sources: SELLAS SEC filings; ClinicalTrials.gov; Yahoo Finance; StockAnalysis. Peer programs differ in platform, indication and stage.
| Firm | View | Target |
|---|---|---|
| Benchmark | Buy | $45 |
| Northland | Buy | $45 |
| Cantor Fitzgerald | Overweight | $40 |
| Canaccord | Buy | $32 |
| Roth MKM | Buy | $30 |
The target implies roughly $176B of market value at current circulating supply.
Watch for bargaining dates, a member survey and any change to Boeing’s contingency plan.
| Q2 metric | 2026 | YoY |
|---|---|---|
| Revenue | $108.5M | +89% |
| Adjusted EBITDA | $28.5M | +$41.0M |
| NdPr production | 840 MT | +41% |
| NdPr sales | 1,006 MT | +127% |
| REO production | 11,072 MT | -16% |
| Measure | Value | Vs. close |
|---|---|---|
| Low target | $58.00 | -3.4% |
| Average target | $75.38 | +25.5% |
| Median target | $75.00 | +24.9% |
| High target | $100.00 | +66.5% |
| Consensus | Strong Buy | 18 analysts |
Friday's 9.14% rebound left MP only 2.26% higher for the week. The operating case is improving, but the earnings bridge remains policy-sensitive: Q2 price-protection income equaled nearly two-thirds of adjusted EBITDA.
Rare-earth trade policy
Independence magnet qualification
10X construction progress
Follow-through after high-volume rally
Sources: Nasdaq market data; MP Materials Q2 2026 results; S&P Global analyst data via StockAnalysis, last updated August 19, 2026. Adjusted EBITDA is non-GAAP. Percentages are calculated from reported figures and may vary slightly due to rounding.
Dogecoin led Bitcoin over the past week, while Coinbase finished Friday 25.6% above its August 14 close. The next signal is turnover: lasting volume can help transaction revenue; a fast price reversal cannot.
| Operating marker | Q2 2026 | Read-through |
|---|---|---|
| Transaction revenue | -21% q/q | Trading softness was visible |
| Trading-volume share | 10.3% | Record; up from 9.1% |
| Subscription/services mix | 48% of net revenue | Buffers fee volatility |
| Adjusted EBITDA | 14th positive quarter | Cost discipline held |
| Buy / Hold / Sell | 22 / 9 / 3 |
|---|---|
| Consensus | Buy |
| Average target | $195.52 · 4.8% above close |
| Median target | $185.00 · 0.8% below close |
| Low / High | $95 / $330 |
NASDAQ: AAOI · Investor snapshot
Applied Optoelectronics, Inc. · U.S. market closed Friday, August 21, 2026
-3.32% Friday
Closed August 21 at 4:00 p.m. EDT.
-9.83% vs. close
Nasdaq last sale at 6:25 p.m. EDT. Extended-hours prices can be thin.
Raymond James and Needham may sell shares over time. AOI is not required to use it.
2% sales commissionAt Friday's close, equal to 5.7% of the 84.91 million shares outstanding on August 20.
The balance sheet is liquid, but capacity expansion consumes cash quickly. The new authorization is 1.18× June cash plus restricted cash.
Midpoint implies 42.0% sequential growth. Management says demand may exceed capacity through mid-2027.
Consensus: Buy from six analysts. Three were Holds. Targets were last updated before the ATM filing.
The SEC illustration is mechanical, not a forecast. Actual prices and issued shares will vary.
Equity funds the 800G and 1.6T ramp. Q3 revenue reaches or exceeds the $272.5 million midpoint.
AOI sells gradually. Investors weigh added capacity against a persistent supply overhang.
Weak pricing forces more shares into the market while production delays or customer timing slow the ramp.
Sources: August 21 Form 8-K, prospectus supplement, Q2 Form 10-Q, company Q2 release, S&P Global analyst data via StockAnalysis, and Nasdaq market data. Calculations use displayed figures and may differ due to rounding.
| Q2 net loss | $9.6M |
| Q2 R&D | $6.3M |
| Cash / share | $0.68 |
| Shares outstanding | 201.9M |
| Share-count growth | +31.9% |
Rivian Automotive · NASDAQ:RIVN
Session range $16.06–$17.15 · Volume 29.89M vs. 24.89M average
Nearly equal to July's net equity proceeds.
Net proceeds from 86.25M shares at $15.50.
The follow-on discount has been repaired.
$7.163B pro forma liquidity ÷ Q2 free-cash outflow.
Rivian's rally repaired the dilution discount, but it also carried the stock to Wall Street's average target. The next rerating needs operating proof: R2 volume, better automotive gross margin and tighter cash use. Three months of free Adventure Network charging, a $3,000 lease contribution and discounted financing may pull R1 deliveries into Q3. They also test pricing power.
Runway is a static comparison, not company guidance. Options-led moves can reverse. Incentives, R2 delays or higher working capital could pressure margins and liquidity.
Sources: Google Finance · Rivian Q2 release · Rivian offers
Headline book value does not flow cleanly to common shareholders.
| Measure | Q2 2026 | Q1 2026 |
|---|---|---|
| Net income | $4.0B | $3.7B |
| Net revenue | $7.6B | $7.3B |
| Credit-loss provision | $485M | $277M |
| Non-interest expense | $2.1B | $2.2B |
| Net worth | $116.5B | $112.5B |
| Firm | View | Target |
|---|---|---|
| B. Riley | Neutral | $7.00 |
| Wedbush | Neutral | $8.00 |
| KBW | Underperform | $8.50 |
| BTIG | Buy | $20.00 |
| 7-analyst aggregate | Hold | $12.25 |
Today’s highest-ranked model selections.