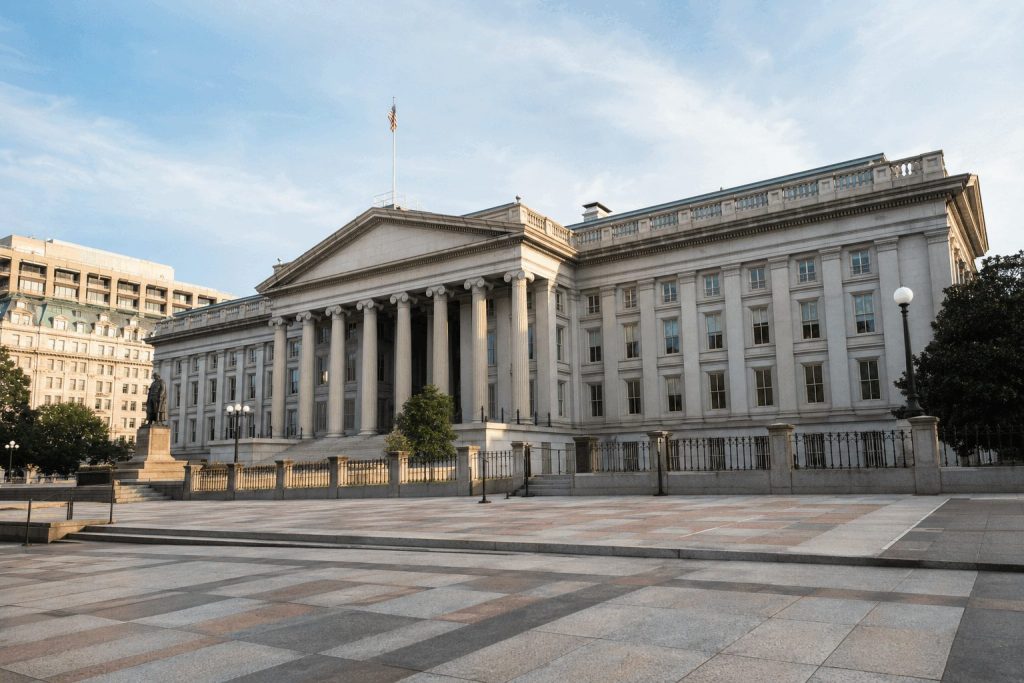
Stanley Druckenmiller criticized the U.S. Treasury’s decision to expand long-bond buybacks on Tuesday, describing it as a step that undermines credibility by attempting to…
·3 min read
Macro / Policy Dashboard
Stanley Druckenmiller and the $4 Billion Treasury Buyback Test
The investor question is not whether one operation can overpower the bond market. It is whether the expanded tool adds liquidity without adding a credibility premium.
New long-end cap
$4B+
Per liquidity-support operation, doubled from $2 billion. Effective September 9, 2026.
30-year yield
5.21%
Market snapshot at 06:27 EDT on August 25, 2026; about 2 basis points lower on the session.
Curve signal
+99 bp
30-year minus 2-year par yield at the August 24 close. A steep curve keeps the term-premium debate alive.
Official U.S. par yield curve
Official close, August 24, 2026. The 20-to-30-year sector is the focus of the enlarged operations.
What moved yields today
Oil −2.8%10Y −2.2 bp30Y −2.0 bp
Lower crude eased inflation pressure early Tuesday. The structural question remains fiscal supply and long-end demand.
Scale: liquidity tool versus funding needs
Old buyback cap
$2B
New buyback cap
$4B+
30-year auction
$25B
Quarterly refunding
$125B
Possible cash balance
~$940B
Linear comparison. The $4 billion cap is 16% of one $25 billion 30-year auction and 3.2% of August’s $125 billion refunding.
Policy calendar
August 19Treasury announces the doubled long-end cap.
September 9Enlarged 10-to-30-year operations begin.
November 4Scheduled program window ends; reassessment follows.
Druckenmiller’s test
Plumbing or price support?
If purchases repeatedly follow yield spikes, investors may demand a larger term premium even when market liquidity improves.
Market transmission
MortgagesLong yields feed housing finance. A lasting term premium lifts affordability pressure.
Duration assetsHigher discount rates weigh on growth equities and long-dated cash flows.
Dollar & goldCredibility concerns can weaken the dollar case while supporting hard assets.
Bank portfoliosLong-bond volatility changes unrealized losses, hedging costs and deposit economics.
Decision table
Outcome
What confirms it
Investor read-through
Liquidity success
Tighter spreads; strong offers; no lasting yield suppression
Lower volatility, neutral credibility effect
Mixed result
Better liquidity, but buybacks cluster after selloffs
Term premium stays elevated
Credibility loss
Weak auctions need concessions while operations expand
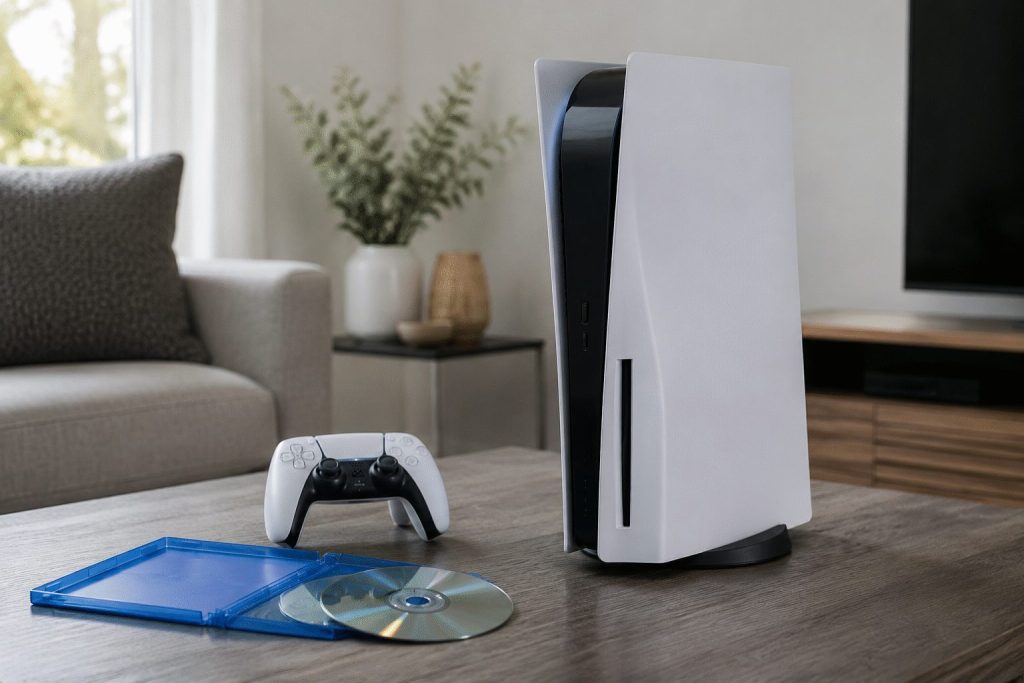
Online searches for "sony playstation" increased in the UK as a consumer boycott extended into its third consecutive day. Campaign organizers are urging users…
The protest targets a digital engine 34× larger than discs.
The August 23–30 blackout asks players to stop purchases, play sessions and subscriptions. Physical revenue is small. Engagement is the material variable.
“We do not anticipate any negative impact on business performance.”Sony FY2026 Q1 investor Q&A, July 31, 2026
Market tape
Tokyo close¥3,832
Aug. 25, 15:30 JST−0.47%
NYSE premarket$24.13
Aug. 25, 04:04 EDT−0.54%
Monday ADR close$24.26 • +1.42%
Physical software¥20.5bn2.2% of gaming sales
Digital ecosystem¥693.8bnsoftware + add-ons + network
Digital unit mix82%full-game downloads
Monthly active users125mJune record; +2% YoY
Q1 gaming revenue mix
Physical ¥20.5bn
Digital games ¥192.0bn
Add-ons ¥293.2bn
Network ¥208.6bn
Combined digital categories equal 74.0% of Game & Network Services sales and 33.8 times physical software.
ADR path: five latest closes
Aug 18Aug 19Aug 20Aug 21Aug 24$23.43$24.26
The ADR rose 3.5% across these five sessions. The boycott began August 23.
Take-Two Interactive Software shares pointed higher before Tuesday's open as investors prepared for a major Grand Theft Auto VI preview. The stock indicated at…
·3 min read
Take-Two Interactive · NASDAQ:TTWO
GTA VI preview: the premium-mix test
Company dashboard centered on Rockstar Games' August 27 extended look
Updated Aug. 25, 2026 06:12 EDT · U.S. premarket
Premarket
$235.59
+0.90% vs. $233.50 close 06:06 EDT, Aug. 25
Monday move
−2.55%
2.6m shares vs. 2.4m 50-day average Close, Aug. 24
52-week position
−12.2%
Below $265.94 high reached July 7
FY27 bookings
$8.0–8.2bn
Guidance reiterated Aug. 7 Midpoint: $8.1bn
Price path into the preview
Selected closes: Aug. 7–24, 2026. The Aug. 24 close was 12.2% below the July peak.
What changed
Official preview versus leaks
Rockstar's extended look arrives at 15:00 EDT on Aug. 27. Take-Two is seeking account data tied to unauthorized clips.
Aug 20
Subpoena requests filed
Aug 27
Extended look, 15:00 EDT
Sep 4
Requested response date
Nov 19
GTA VI launch
The $20 premium ladder
Edition
Price
Standard
$79.99
Ultimate
$99.99
Upgrade
+$20 / +25%
Illustrative incremental consumer spend
1m upgrades: $20m · 5m: $100m · 10m: $200m Gross consumer spend, not Take-Two net bookings.
Quarter and full-year frame
Metric
Reading
Q1 FY27 net bookings
$1.39bn · −3% YoY
Q1 GAAP revenue
$1.53bn
Q1 GAAP net result
−$34.1m
Recurrent share of bookings
84%
FY27 GAAP revenue outlook
$7.9–8.1bn
FY27 operating cash flow
>$1.0bn
Recent analyst recommendations
Firm · date
View
Target
JPMorgan · Aug 11
Overweight
$310
Roth · Aug 10
Buy
$300
Wells Fargo · Aug 10
Overweight
$300
Oppenheimer · Aug 10
Outperform
$280
BTIG · Aug 10
Buy
$313
Five-target midpoint: $300, about 28.5% above Aug. 24 close.
Valuation and sensitivity
Approximate market value
$43.7bn
$233.50 close × 187.1m expected Q2 basic shares; illustrative.
Price / FY27 bookings midpoint
5.4×
Market value divided by $8.1bn. This is not a standard earnings multiple and excludes net debt.
Target range
$280–$313 among the five recent actions above.
Investor decision map
Bull case
High preview engagement converts into stronger pre-orders and an above-plan Ultimate mix. A 10m-edition upgrade scenario adds $200m of gross consumer spending.
Base case
The preview stabilizes marketing control. Fiscal 2027 bookings remain near the $8.1bn midpoint and the November 19 launch holds.
Bear case
Technical criticism, weak premium mix or another delay narrows the valuation gap. Muted engagement after Aug. 27 is the first observable warning.
Sources: Take-Two fiscal Q1 FY2027 release (Aug. 7, 2026); Rockstar Games GTA VI page and pre-order announcement; Benzinga market data and analyst log; MarketWatch Aug. 24 close; The Verge Aug. 24 leak-report update. Price and volume data are time-stamped above. Calculations are illustrative and may not equal reported net bookings.
Ticketmaster’s latest ticket recovery puts anti-scalping controls back at the centre of the investment case for parent Live Nation Entertainment, Inc.. The group is…
·3 min read
Ticketmaster · Live Nation Entertainment (NYSE: LYV)
Ticket recovery meets remedy risk
The operating question is whether anti-scalping controls strengthen Ticketmaster’s primary marketplace while legal remedies constrain fees, contracts or ownership.
San Francisco 49ers principal owner Jed York’s legal proceedings have presented a governance challenge for a private sports portfolio with a multibillion-dollar valuation. The…
·3 min read
Private sports assets • governance dashboard
Jed York: the fine is tiny. The review is not.
The $1,150 criminal fine is economically invisible beside the 49ers’ latest $8.5 billion transaction valuation. Investor attention belongs on league discipline, cross-border owner tests and commercial reaction across a three-club network.
Snapshot: August 25, 2026, 11:42 CEST / 05:42 EDT / 02:42 PDT. U.S. premarket active; London cash market open.
Primary unresolved catalyst
NFL review pending
Personal-conduct policy review announced August 24. No disclosed suspension, ownership change or sponsor action as of the snapshot.
49ers transaction value
$8.5B
Implied by a roughly 6% minority sale approved May 20, 2025.
Criminal fines
$1,150
Two misdemeanors; concurrent one-day terms credited as served.
Fine / valuation
0.0014 bp
Calculated: $1,150 ÷ $8.5B × 10,000.
Cross-border holdings
3 clubs
49ers, Leeds United and a Rangers consortium interest.
Valuation context — private value versus listed benchmark
49ers
$8.50B
Manchester United
$4.09B
49ers figure: private minority-transaction valuation, May 2025. Manchester United plc (NYSE: MANU): market capitalization calculated from $23.70 August 24, 2026 close and 172.43 million shares. These are different valuation measures; the comparison shows scale, not relative cheapness.
Where the risk can travel
Daily management is delegated: Al Guido runs the 49ers; Paraag Marathe chairs Leeds and is vice-chair at Rangers.
Exposure map
Asset
Ownership disclosure
Current regulator / gatekeeper
Investor watchpoint
San Francisco 49ers
York principal owner; York family retains control
NFL
Policy review Scope and discipline
Leeds United
49ers Enterprises Global Football Group owns 100%; York and Marathe each >10% of voting entity
Independent Football Regulator / Premier League
Suitability Any incumbent-owner assessment
Rangers
Consortium including 49ers Enterprises acquired 51%
Scottish FA
Governance Board, sponsor and fan response
Manchester United (NYSE: MANU)
No York link; public benchmark
NYSE / SEC / football regulators
Listed read-through No direct exposure
Timeline
May 20, 2025
NFL approves roughly 6% 49ers minority sale at a reported $8.5 billion valuation.
May 30, 2025
U.S. consortium including 49ers Enterprises completes 51% Rangers acquisition; £20 million commitment announced.
Feb. 2026
49ers elevate Al Guido to chief executive; York stays principal owner.
Aug. 24, 2026
York pleads no contest to two misdemeanors. NFL announces personal-conduct review.
Next
Watch for league discipline, regulator inquiry, sponsor action or explicit closure.
Scenario grid
Contained; review closesLikelyLow impact
Fine or formal reprimandPossibleLow impact
Owner suspension / duties limitedLowerMedium
Cross-border suitability reviewLowerMedium
Sponsor or partner pullbackLowerHigh impact
Qualitative framework, not a probability forecast. Operational delegation reduces disruption; reputational outcomes remain nonlinear.
Investor conclusion
The direct penalty is immaterial by any valuation measure. The investible question is whether the NFL converts a personal legal event into a governance constraint, and whether English or Scottish gatekeepers follow. Until that happens, the case is a key-person and reputation risk—not a cash-flow event.
Sources: NFL/AP reports dated May 20, 2025 and August 24, 2026; San Francisco 49ers management announcement, February 2026; Leeds United corporate ownership disclosure accessed August 25, 2026; Independent Football Regulator ODSE guidance effective May 5, 2026; NFL/AP Rangers transaction report, May 30, 2025; StockAnalysis MANU history for August 24, 2026 close. Calculations by TS2.
Space Exploration Technologies Corp. shares rose 1.55% to $137.09 before Tuesday's open. The move followed disclosure that President Donald Trump bought up to $50,000…
·3 min read
NASDAQ: SPCX · premarket
SpaceX
A tiny presidential holding creates a large policy-optics question. Federal launch approvals and contract cadence remain the real earnings channel.
$137.09 +1.55%
Premarket price at 05:07 EDT, August 25, 2026 · Previous close $135.00, -1.44% at 16:00 EDT, August 24
Disclosure scale
$15,001-$50,000
Trump's reported June 23 SpaceX purchase range.
0.0000027%
Maximum disclosed value as a share of SpaceX's $1.83 trillion market capitalisation. The optics outweigh the economics.
Market cap$1.83TAugust 25, 2026
Q2 revenue$7.81B+92% year over year
Q2 net loss$541Mversus $1.01B loss
Q2 capex$18.37B2.35× quarterly revenue
Valuation map
PremarketConsensus targetIPO
Q2 revenue engine
Connectivity
$4.291B
AI
$2.561B
Space
$962M
Connectivity generated $1.656 billion of operating profit. Space lost $542 million; AI lost $1.257 billion. Quarter ended June 30, 2026.
Why the stock is moving
Fresh catalyst: A disclosure released August 22 shows Trump bought SpaceX shares on June 23. The White House says independent institutions direct the portfolio.
Federal contractorLaunch approvalsCommercial-launch policyGovernance optics
The administration last week ordered steps to increase U.S. commercial launches. The measurable investor channel is approval speed and contract flow, not the small holding.
Analyst split
Firm
Rating
Target
Date
Morgan Stanley
Buy
$300
Aug. 20
DZ Bank
Sell
n/a
Aug. 20
William Blair
Buy
n/a
Aug. 20
Clear Street
Buy
$217
Aug. 18
35-analyst consensus: Buy. Average target: $213.50. Range: $75-$450. Analyst data checked August 25, 2026.
TTM revenue$23.04B+121.9%
TTM net income-$8.89BLatest available
Forward P/E104.05×Estimate-based
Aug. 24 volume60.2MShares traded
Investor checklist
Signal
What to watch
Why it matters
Policy
Launch licensing and federal contract cadence
Could turn political attention into revenue
Cash intensity
AI capex after $15.83B in Q2
Free-cash-flow risk dominates valuation
Profit mix
Connectivity margin durability
It currently funds losses elsewhere
Governance
Official disclosures and procurement safeguards
Optics can widen the risk premium
Sources: Reuters, SpaceX Form 10-Q filed with the SEC, SpaceX investor relations, StockAnalysis/S&P Global Market Intelligence and CBOE. Price data is time-stamped above. Financial figures are in U.S. dollars. Calculations may vary due to rounding.
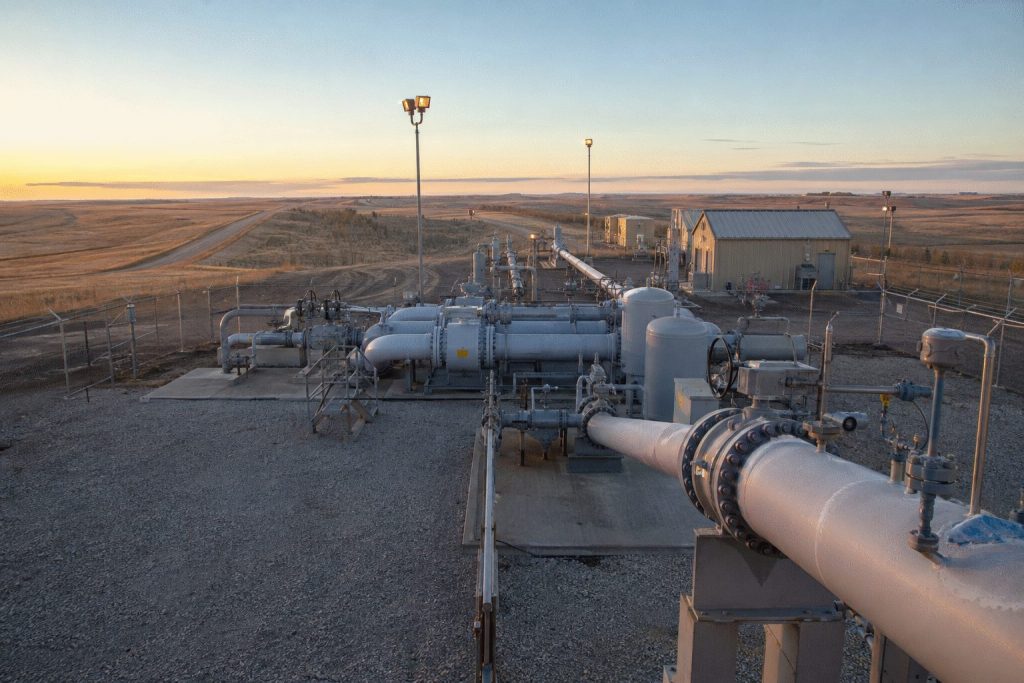
Interest in Keystone XL searches has resurged amid rising trade tensions between the United States and Canada. However, the project presented to investors is…
The old name is trending. The investible project is different.
Prairie Connector is smaller than Keystone XL, already mostly contracted and still exposed to cross-border policy risk after U.S.-Canada trade talks collapsed.
Data snapshot: August 25, 2026, 03:18 MDT / 05:18 EDT / 11:18 CEST. U.S. premarket active; Canadian cash market closed.
Proposed capacity
550k
barrels per day
Prairie Connector
Firm service
450k
81.8% contracted
20-year binding terms
Original KXL
830k
barrels per day • cancelled design
Decision gate
Mid-2027
South Bow target
Capacity reality
kb/d
830Original KXL
585Keystone 2025
550Prairie plan
450Firm service
Prairie Connector is 33.7% smaller than the original Keystone XL plan, but contracted service already covers 81.8% of proposed capacity.
Policy clock
Apr. 30, 2026U.S. permit granted for a 36-inch Montana border crossing.
May 29South Bow confirms 20-year binding shipper commitments.
Aug. 21–22Canada suspends U.S. trade talks and announces retaliation.
Mid-2027Target for final investment decision.
August 24 listed-exposure moves
CVE
−2.31%
SU
−1.53%
CNQ
−1.40%
SOBO
−1.09%
ENB
−0.75%
U.S.-listed closes at 16:00 EDT. No fresh pipeline-breakthrough premium appeared.
Oil backdrop
WTI settlement
$85.01/bbl
Daily move
−2.35%
Brent settlement
$92.17/bbl
Daily move
−2.35%
Timestamp
Aug. 24 settlement
A broad crude selloff clouds the pipeline-specific equity signal.
Existing network benchmark
Year
Keystone flow
Change
2024
624k bpd
Record
2025
585k bpd
−6.3%
Prairie proposal
550k bpd
94% of 2025 flow
2025 throughput was constrained after an April incident and reduced operating pressure.
Transmission map
Driver
Investor consequence
20-year contracts
Lower volume risk before financing.
Cross-border permit
Improves route credibility, but remains reversible.
The proposal still needs multiple approvals, financing and a final investment decision. Route litigation, construction inflation, policy reversal and slower Canadian production growth could delay or weaken returns.
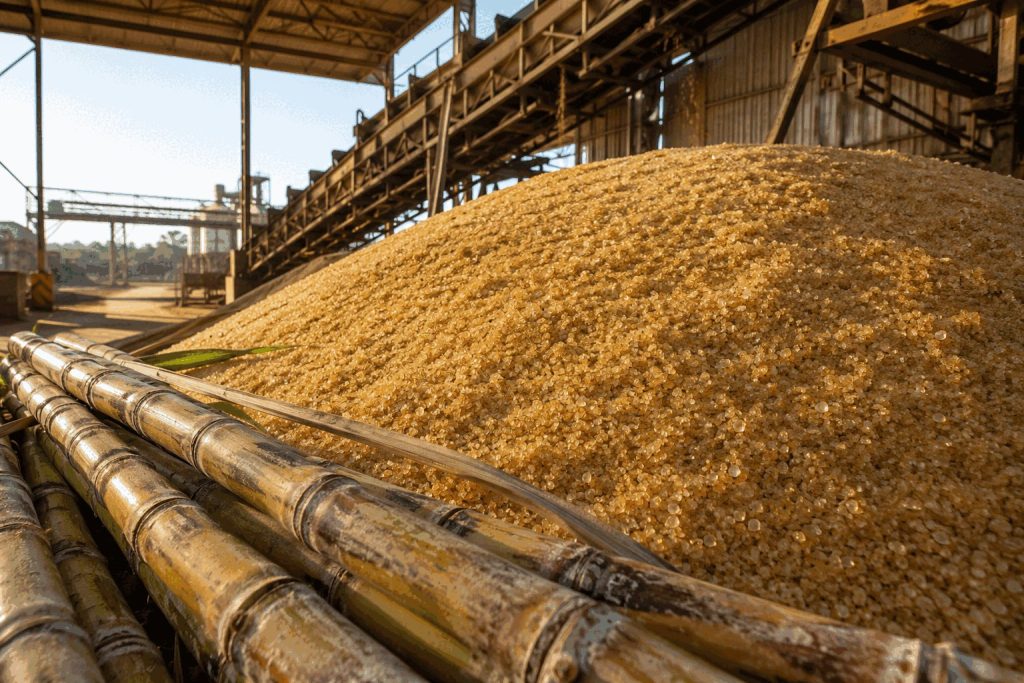
Raw sugar’s three-week surge broke sharply on Monday. ICE futures fell 2.3% to 17.20 cents a pound at 11:58 GMT, retreating from last Thursday’s…
·3 min read
Sugar · ICE No. 11 · Market/Asset/Sector
India broke the squeeze. Weather still owns the tail risk.
A 1-million-ton import quota is large versus India’s thin opening buffer, but small beside annual use. That explains the sudden futures retreat without proving a durable global surplus.
Data cut: August 25, 2026, 05:06 EDT · ICE Sugar No. 11 session active (03:30–13:00 EDT)
Last verified
17.20¢
per lb · August 24, 11:58 GMT
Session move
−2.3%
Monday intraday Reuters reference
Retreat from peak
−5.8%
versus 18.26¢ on August 20
Peak three-week run
+27%
ADMIS estimate at last week’s high
Price path: squeeze, then policy reset
Reference points combine closing/last prices and the verified August 20 high; they are not a continuous settlement series.
Bathla Group’s entry into voluntary administration puts a major private borrower at the forefront of Australia’s rapidly expanding private-credit sector. Regulatory filings referenced by…
·3 min read
bathla group · australia private credit
A$3.2bn restructuring tests collateral, concentration and liquidity
The administration is larger than one listed lender’s balance-sheet exposure. The key variables are fund-level loan concentration, project completion and the time required to turn first-mortgage security into cash.
Data cut: 25 Aug 2026, 18:47 AEST · ASX closed at 16:00 AEST
Bathla liabilities
A$3.2bn
At 30 Jun 2025 · regulatory filings
Centuria direct facility
A$4.5m
0.14% of Bathla liabilities
Centuria fund facilities
6
All disclosed as first-mortgage secured
CNI session move
-0.37%
25 Aug 2026 ASX close
Concentration signals
Bathla liabilities
A$3.2bn
CNI direct loan
A$4.5m
ASIC survey snapshot
A$76bn
Bars use separate scales: the first two compare borrower liabilities and CNI’s direct loan; the ASIC bar is a market snapshot, not Bathla exposure.
Transmission map
CollateralSoft sales can reduce recovery values.
LiquidityRedemptions may precede project exits.
ContainmentFirst mortgages and project completion can limit losses.
What is verified
Item
Current reading
Investor implication
Administrator
Teneo; Universal Property Group and Raj & Jai Construction
Control shifts to project stabilisation and creditor recovery
Bathla pipeline
5,000+ homes on company website
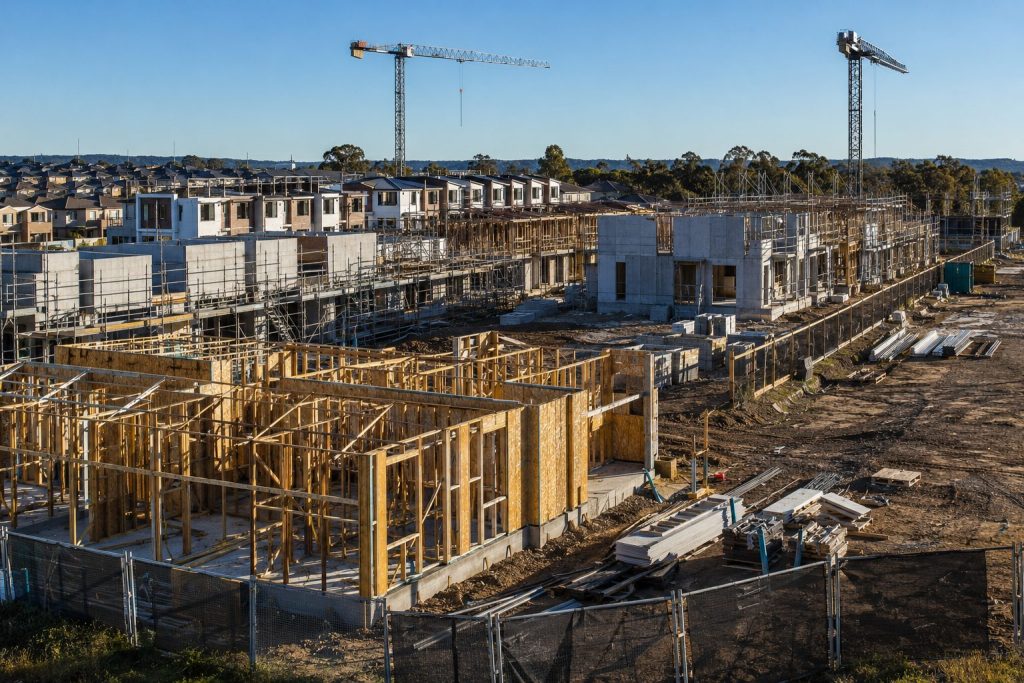
Completion delays can tighten western Sydney supply
Centuria security
First mortgages; partial cross-collateralisation
Recovery depends on asset values and timing
ASIC private-credit survey
22 managers, 52 funds, ~A$76bn AUM
Valuation and concentration are active enforcement themes
RBA system view
Private credit below 2% of financial-system assets
Systemic risk appears contained; fund-level risk can still be material
Next catalyst
First creditors’ meeting reported for 4 Sep 2026
Watch secured debt, cash needs and project-by-project recovery
Projections for the Social Security Administration’s 2027 cost-of-living adjustment currently center around 3.5%. Based on July’s benefit base, this would increase annual Social Security…
·3 min read
U.S. Social Security · 2027 COLA
One CPI month known; $45B–$60B payment-flow range remains
Macro dashboard centered on “social security administration 2027 cola”
Data cutoff: Aug. 25, 2026, 04:35 EDT U.S. equity premarket open
Forecast range
3.4–3.6%
Private estimates after July CPI
July CPI-W
+3.4%
Year over year; BLS, Aug. 12
OASDI payments
$138.4B
July 2026 monthly total
Beneficiaries
75.724M
Social Security, SSI or both; July 2026
COLA path: history and current estimates
$56.5B–$59.8B annualized liftCalculated from July’s $138.411B monthly OASDI base. Assumes an unchanged base and beneficiary mix; excludes SSI.
Current forecasts
Source
COLA
TSCL
3.6%
AARP
3.5%
Mary Johnson
3.4%
Trustees
2.7%
Private estimates dated Aug. 12, 2026. Trustees’ intermediate assumption published June 2026.
What the percentages mean
Scenario
Retired worker / month
Annual OASDI flow
2.7%
+$56.32
+$44.8B
3.4%
+$70.92
+$56.5B
3.5%
+$73.01
+$58.1B
3.6%
+$75.10
+$59.8B
Benefit illustration uses the July average retired-worker payment of $2,085.98.
Beneficiary base · July 2026
Retired workers54.785M
Other OASDI16.558M
SSI recipients7.300M
Some people receive both Social Security and SSI; groups are not additive.
Transmission to markets
CPI-W July–September average
→
January checks Inflation-linked cash flow
→
Demand mix Staples, housing, utilities, health
Channel
Higher COLA
Investor read
Consumer spending
More nominal cash
Supports senior-heavy categories
Inflation
Backward-looking
Signals prices already rose
Federal outlays
Higher indexed cost
Widens benefit-flow requirement
Medicare deductions
Possible offset
Net check may lag headline COLA
Policy and solvency
2034
Projected combined trust-fund depletion year without legislation.
83%
Share of scheduled benefits that continuing income could cover then.
$1.60T
Benefits paid in calendar 2025.
Known vs unknown
Known
July CPI-W: +3.4% year over year
Known
2026 COLA: 2.8%
Open
August and September CPI-W
Open
2027 Medicare premium deductions
Next dated catalysts
Sep. 11 08:30 EDTBLS publishes August CPI, the second COLA input month.
Oct. 14 08:30 EDTBLS publishes September CPI; SSA can finalize 2027 COLA.
Microsoft Corporation's Modern Warfare 4 beta begins its crucial free-access stage on Friday. Initial responses from Steam users are varied. This phase serves as…
·4 min read
NASDAQ: MSFT · COMPANY
MW4 beta: a 51% approval test
Call of Duty's free weekend is the next live check on whether Microsoft can reverse falling Xbox content revenue before the October launch.
Dashboard time: Aug. 25, 2026 04:35 EDT / 10:35 CEST U.S. premarket active Latest stock price: Aug. 24 close
$487.31
MSFT close · Aug. 24, 16:00 EDT
+0.84%
Monday regular-session move
51%
positive Steam reviews · 1,529 total
−10%
Xbox content & services · fiscal Q4 YoY
The conversion funnel
AUG 21–25Paid early access Preorder-intent cohort
AUG 26Open preload Download demand
AUG 28–SEP 1Free open beta Mass sentiment test
OCT 23Global launch Conversion and mix
What changes next: the free beta broadens the audience beyond preorders and adds Switch 2. A rising approval rate would be the cleanest public sign of improving launch momentum.
Price ladder
Edition
Steam price
Standard
$69.99
Vault
$99.99
Premium
+$30 / +42.9%
Displayed on Steam early Aug. 25. Microsoft does not publish live edition mix.
Gaming weakness inside a strong quarter
Total revenue
+18%
More Personal Computing
−4%
Xbox content/services
−10%
Fiscal Q4 ended June 30, 2026; year-over-year changes. Bars show direction and relative magnitude, not revenue share.
Analyst recommendations
Firm
Rating
Target
Wells Fargo · Aug. 12
Overweight
$700
Bernstein · Aug. 10
Outperform
$660
Tigress · Aug. 5
Buy
$690
Stifel · Jul. 30
Hold
$450
Published recommendations compiled by Benzinga. Consensus target tracked by S&P Global: $569.56, about 17% above the Aug. 24 close.
Monday gaming-share context
Regular-session changes on Aug. 24, 2026. Peer moves provide market context; they were driven by different company-specific factors.
Investor checklist
Steam approvalDoes 51% improve after free access?
Player reachVisible engagement across more platforms.
Premium mixVault demand protects launch revenue.
Execution riskBugs, balance and retention can weaken conversion.
No live preorder or cross-platform engagement totals have been disclosed.
Valuation snapshot
Market capitalization
≈$3.62tn
Trailing P/E
≈27.1×
Forward P/E
≈24.5×
FY2026 revenue
$331.8bn
FY2026 EPS
$17.95
Market cap calculated from 7.43bn shares and the Aug. 24 close. Ratios are approximate.
Why the stock may not react
Modern Warfare 4 is important to Xbox's holiday content mix. Microsoft, however, earns most of its valuation from cloud and enterprise software. A beta surprise must be large enough to change gaming estimates before it can compete with Azure as a stock driver.
CATALYST: OPEN BETARISK: MIXED REVIEWSLAUNCH: OCT 23
Sources: Microsoft FY2026 Q4 results, Call of Duty official beta materials, Steam, MarketWatch and published analyst records. Beta review counts and product prices checked early August 25, 2026.
McDonald’s Corporation is attracting renewed Canadian attention through its second World Menu Heist campaign. The initiative assesses if reintroducing popular items from other markets…
McDonald's Corporation • NYSE:MCD • Company dashboard
World Menu Heist tests a slowing international engine
Seven products from six overseas menus give McDonald’s Canada a traffic experiment built from existing ideas. The question is whether novelty can reaccelerate 1.5% international comparable-sales growth.
Market snapshot: August 25, 2026, 04:19 EDT (10:19 CEST). U.S. premarket active.
Aug. 24 close
$272.54
▲ 0.59%
16:00 EDT • Google Finance
Premarket
$272.83
▲ 0.11% vs close
Latest available at 04:14 EDT
Market value
$192.86B
707.64M shares outstanding
Since launch
+2.1%
$266.99 on Aug. 18 to $272.54
Comparable-sales slowdown
Q2 2026
1.3%Global
0.8%U.S.
1.5%IOM
1.9%IDL
International Operated Markets slowed from 4.0% a year earlier. Canada’s promotion targets the exact segment needing stronger traffic.
Menu reuse economics
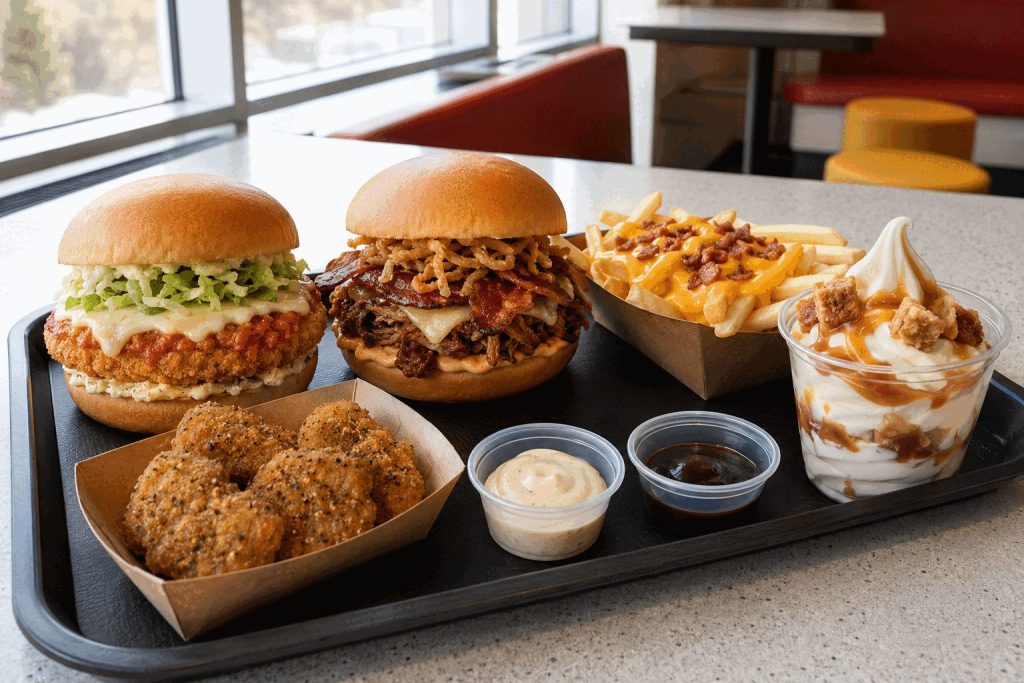
7 productsTwo entrées, fries, nuggets, dessert and two sauces.
6 marketsAustralia, Spain, France, Japan, Netherlands and Sweden.
Year twoThe Canadian concept returned after its 2025 debut.
Limited timeScarcity drives trial, but durability remains unproved.
Reusing proven global recipes can shorten development work. McDonald’s does not disclose product-level costs or sales.
August 24 restaurant-stock moves
CMG
+3.04%
YUM
+2.85%
MCD
+0.59%
SBUX
+0.38%
S&P 500
−0.28%
MCD beat the index but lagged restaurant peers.
Analyst map
$317.52
Average target • +16.5%
13 Buy10 Hold0 Sell
Close $272.54
Average $317.52
Low $280High $390
Franchise model
Systemwide restaurants
46,028
Franchised share
~95%
Q2 systemwide sales
$37B • +5%
Q2 revenue
$7.10B • +4%
Adjusted EPS
$3.38 • +6%
More franchise sales translate into rents and royalties; operators carry most restaurant costs.
Valuation snapshot
P/E ratio
22.13×
Dividend yield
2.73%
Quarterly dividend
$1.86
Beta
0.41
52-week range
$260.96–$341.75
Below 52-week high
20.3%
What investors should watch
Signal
Meaning
Guest counts
Best evidence that novelty adds visits.
Average check
Loaded fries, sauces and dessert may increase baskets.
Kitchen speed
Complex builds can reduce throughput.
Post-promotion traffic
Separates repeat demand from launch trial.
Risk panel
Canada sales and product margins are undisclosed. Limited-time scarcity may front-load demand. More ingredients can raise waste, slow kitchens and squeeze franchisee profitability.
Investor read: a useful traffic experiment, not a standalone earnings forecast.
The Trump administration plan to revoke a large number of visas features an eye-catching headline figure, but the actual impact on travel is much…
·4 min read
U.S. visa policy · macro transmission
200,000 revocations: large headline, narrow first-order shock
The proposed ceiling targets B1/B2 holders who later sought asylum. The direct count is small against U.S. inbound travel, but policy spillover could alter bookings before the 2026 World Cup.
Data cut: Aug. 25, 2026 10:02 CEST / 04:02 EDT U.S. premarket newly open
Reported ceiling
200,000
B1/B2 holders linked to asylum claims; final count dynamic.
Share of 2026 arrivals
0.28%
Against NTTO's 70.5 million official forecast.
Gross spend ceiling
$366M
One lost trip per visa × $1,829 average; not a forecast.
2025 travel exports
$250.2B
International visitor spending, down 0.6% year over year.
Illustrative direct exposure — not a forecast
Method: one hypothetical lost future visit per revoked visa × NTTO's $1,829 average 2025 U.S. spend by an overseas visitor. Many affected people are already in the U.S.; actual lost inbound trips may be much lower.
Scale check
Baseline
Reading
Signal
2025 arrivals
68.3M
Actual
2026 arrivals
70.5M
+3.2% forecast
March 2026
5.54M
+2.0% YoY
200K cohort
~1 day
At 2026 run-rate
Prior revocations
175K
Past 18 months
Policy timeline
2016–2026Issuance window for B1/B2 visas under review.
Past 18 monthsAbout 175,000 visas revoked on multiple stated grounds.
Aug. 22Judge strikes down a separate 75-country immigrant-visa freeze.
Aug. 24Up-to-200,000 asylum-linked plan reported after market close.
Coming weeksState Department expected to publish implementation details.
Sector sensitivity
Channel
First-order exposure
Investor metric
Online travel agencies
Cross-border booking conversion
U.S. inbound room nights
Gateway hotels
International occupancy and ADR
New York, Miami, Los Angeles RevPAR
International airlines
Visitor-origin load factors
Advance bookings and yields
Airports / concessions
Passenger and retail spend
International enplanements
Domestic leisure
Lower direct sensitivity
Drive-to demand
Transmission map
ScopeAsylum-linked cohort only.
SignalPerceived entry uncertainty.
BehaviorSearches and bookings soften.
MarketOTAs, hotels, airlines reprice.
Key asymmetry: direct arithmetic is small; an expansion to ordinary visitors would make the signaling channel much larger.
Investor conclusion
The proposed ceiling is only 0.28% of forecast 2026 arrivals, and the affected population does not map one-for-one to future trips. The near-term market test is therefore confidence. Watch the formal notice, country mix, court challenges, inbound searches and cancellation rates before treating 200,000 as an earnings input.
WestJet's recently negotiated contract for cabin crew sets a new cost standard among North American airlines. The major change is not just the highlighted…
·3 min read
Airline labor-cost benchmark
Paid ground time joins the wage bill
WestJet's ratified cabin-crew agreement expands compensation beyond flying hours. The disclosed wage path compounds to roughly 18.85%; the undisclosed duty-premium formula is the key margin variable.
Data cut: Aug. 25, 2026 09:01 CEST / 03:01 EDT North American markets closed
Ratification
90.2%
Vote in favour; about 4,400 WestJet cabin crew covered.
Wage path
18.85%
Calculated compounded lift: 13%, then 2.75%, then 2.5%.
U.S. airline basket
+0.62%
Simple Aug. 24 average: JBLU, LUV, DAL and UAL.
Vs. S&P 500
+0.90 pp
Basket +0.62% against index -0.28% on Aug. 24.
Wage lift and ground-pay structure
Cumulative result assumes each disclosed increase applies sequentially. The separate duty-period premium is not included because its rate was not disclosed.
Canadian benchmark
Measure
WestJet
Air Canada
Workers
~4,400
~15,000
Year-one raise
13%
8%–13%
Ground pay
Premium; rate private
60%, to 70%
Term
2026–2028
To Mar. 2029
Air Canada ranges vary by seniority and Rouge/mainline assignment.
Policy and bargaining timeline
Aug. 2WestJet stoppage begins; scheduled 737 and 787 flying halted.
Aug. 3Tentative agreement ends the disruption.
Aug. 24Cabin crew ratify with 90.2% support.
Oct. 2026First disclosed wage step: +13%.
Jan. 2027Second step: +2.75%.
Jan. 2028Final disclosed step: +2.5%.
Listed exposures — Aug. 24 close
Exposure
Close
Move
Read-through
Onex (TSE:ONEX)
C$114.15
+0.67%
WestJet majority owner
JetBlue (NASDAQ:JBLU)
$4.95
+1.23%
Highest basket move
Southwest (NYSE:LUV)
$40.71
+0.82%
U.S. domestic exposure
Delta (NYSE:DAL)
$82.48
+0.08%
Boarding-pay adopter
United (NASDAQ:UAL)
$113.57
+0.35%
Ground-pay adopter
S&P 500
7,652.86
-0.28%
Broad benchmark
Margin transmission
1. Paid hoursMore ground duties enter compensation.
2. Unit costCASM rises unless productivity offsets it.
3. Commercial responseFares, capacity and staffing adjust.
4. EarningsLoad factor and pricing decide margin impact.
Watch next: WestJet schedule completion, fare response, compensated duty-hour disclosure, and peer bargaining demands.
Investor conclusion
The market did not price an immediate sector shock on Monday. The agreement still matters. Its structure moves cabin-crew economics from a simple wage-rate question toward total compensated duty time. Until WestJet discloses the premium formula, investors should treat the 18.85% compounded wage path as a floor—not a full estimate of labor-cost growth.
Callaway Golf Company is confronting a challenge over brand management following backlash to a partner's driver ad, which was subsequently taken down. The controversy…
·4 min read
Callaway Golf Company · NYSE:CALY
Ad backlash vs equipment momentum
U.S. market closedGoogle Trend: callaway golf ad
Close: August 24, 2026, 16:00 EDT Dashboard: August 25, 2026, 02:42 EDT
Close
$15.79
-0.63% Monday
Vs S&P 500
-0.35pp
CALY -0.63%; index -0.28%
Volume
1.16m
51.6% of 3-month average
Since Aug. 4
-19.3%
From $19.57 to $15.79
Price vs analyst range
S&P Global consensus implies 29.8% upside; target range $19–$23.
Recommendation snapshot
Firm
View
Target
B. Riley
Buy
$23
KeyBanc
Overweight
$22
Goldman Sachs
Neutral
$19
Morgan Stanley
Equal Weight
$19
JPMorgan
Neutral
$18
Catalyst clock
AUG 21
Good Good posts Quantum driver ad
AUG 22
Video removed; apologies issued
AUG 24
CALY closes -0.63% on light volume
NOVEMBER
Good Good PGA Tour event and Q3 results
Q2 operating scorecard
Metric
Value
Change
Net sales
$612.2m
+2.0%
Golf equipment
$430.3m
+4.5%
Golf balls
$113.8m
+14.8%
Adjusted gross margin
48.5%
+460bp
Adjusted EBITDA
$124.9m
+35.8%
YTD buybacks
$84m
5.9m shares
2026 guidance reset
Previous EBITDA midpoint
$222m
Current EBITDA midpoint
$253m
Midpoint increased about 14%. Current range: $246m–$260m.
LONDON, August 25, 2026, 07:14 BST — Whitbread will allocate £40 million to close its Beefeater restaurants as the company shifts its strategy towards…
·3 min read
Whitbread plc · LON:WTB
Beefeater exit dashboard
Pre-marketCompany
Market data: August 24, 2026, 16:30 BST Dashboard: August 25, 2026, 07:14 BST
Close
2,463p
+1.61% on Monday
Vs FTSE 100
+1.26pp
WTB +1.61%; FTSE +0.35%
Volume
268.7k
42.1% of 50-day average
52-week high gap
-25.4%
High: 3,302p
Analyst target range
Average upside +9.0%Low downside -16.8%High upside +50.2%
Recommendation mix
View
Analysts
Share
Strong Buy
6
33%
Buy
1
6%
Hold
8
44%
Sell
3
17%
18-analyst S&P Global consensus; average target last updated June 22, 2026.
Closure and reporting clock
AUG 31
Last day to use loyalty vouchers
SEP 3–7
Other brands and Brewers Fayre close
SEP 10
All 106 Beefeater restaurants close
OCT 15
Whitbread FY27 interim results
Q1 FY27 operating pulse
Metric
Change
Signal
Group sales
+2%
£727m
UK accommodation sales
+3%
Core hotel demand
UK RevPAR
+2%
Pricing/occupancy
London accommodation
+7%
Outperformed UK
UK food & beverage
-5%
Exit exposure
Germany accommodation
+13%
Local currency
Transition economics
FY27 PBT hit
£40m
FY31 incremental annual PBT target
£100m
Targeted recurring FY31 uplift is 2.5× the one-year FY27 transition hit. Periods differ.