Premarket price
$15.96
−0.68%
3.0% above $15.50 offering
Rivian Automotive declined 4.35% on Friday to close at $16.07. Ahead of the market open, shares were at $15.96 as of 09:00 EDT, shedding another 0.68%.
The consolidated $179 million profit still depends on software and services.
| Measure | Q2 2025 | Q2 2026 | Change |
|---|---|---|---|
| Production | 5,979 | 12,613 | +111% |
| Deliveries | 10,661 | 12,194 | +14% |
| Automotive revenue | $927M | $1.143B | +23% |
| Software revenue | $376M | $515M | +37% |
| Net loss | −$1.115B | −$837M | Improved $278M |
| Measure | Value | Context |
|---|---|---|
| June 30 liquidity | $5.846B | −$742M from December |
| H1 capital spending | $734M | Normal plant and platforms |
| July equity raise | ≈$1.3B | 86.25M shares at $15.50 |
| April VW funding | $1.0B | ≈63M shares at $15.90 |
| R2 ramp cost | ≈$100M | Incremental Q2 cost |
| Market value | $23.27B |
| 52-week range | $12.39–$22.69 |
| Average analyst target | $19.23 |
| Target range | $13–$25 |
| Implied upside to average | 20.5% |
High short interest and above-average volume can magnify R2 news.
Watch first: automotive gross profit per vehicle as R2 volume rises.
Cash test: inventory and deferred-revenue swings must normalize.
Valuation test: $15.50 is the fresh financing anchor.
Risk: launch quality, warranty costs, demand and tariffs can delay margin gains.
| Measure | 2025 | 2026 | Growth |
|---|---|---|---|
| Q2 GAAP EPS | $0.24 | $0.33 | +37.5% |
| Q2 core EPS | $0.31 | $0.40 | +29.0% |
| First-half GAAP EPS | $0.51 | $0.72 | +41.2% |
| First-half core EPS | $0.64 | $0.83 | +29.7% |
| Marker | Price/target | Upside | Core P/E |
|---|---|---|---|
| Premarket | $14.14 | — | 8.6× |
| Mizuho revised target | $16.00 | +13.2% | 9.7× |
| 17-analyst average* | $22.22 | +57.1% | 13.5× |
| Consensus range* | $19–$25 | +34% to +77% | 11.5×–15.2× |
| Utility debt financing, H1 | $4.4bn |
| Underground lines built, Q2 | 37 miles |
| Strengthened/covered lines, Q2 | 100 miles |
| Wildfire Fund utility commitments | $10.5bn |
Sources: PG&E Q2 2026 results; PG&E Senate Bill 492 statement; Barron's premarket report; CPUC wildfire fund; MarketScreener consensus. Figures timestamped above.
| Q2 TPV | $486.4bn |
| Q2 transaction-margin dollars | $3.9bn |
| Adj. operating margin | 17.4% |
| 2026 TM-dollar outlook | ≈$15.6bn |
| Year-end savings target | ≈$400m |
| H2 transformation charges | up to $140m |
| Driver | Investor read |
|---|---|
| Bid withdrawal | Premium removed |
| Low multiple | Downside support |
| Margin contraction | Execution burden |
| Branded checkout | Share test |
Third-quarter results must show savings offsetting cloud, fraud and marketing investment. Faster transaction-margin growth would support a rerating; another margin miss could keep PayPal below the abandoned offer price.
Sources: PayPal Q2 2026 results; Reuters reports dated July 28 and August 28, 2026. Company measures include non-GAAP figures.
| Company | P/E | Move |
|---|---|---|
| ServiceNow | 89.3× | +4.5% |
| Salesforce | 23.5× | +1.6% |
| Workday | 41.4× | +5.6% |
| Oracle | 27.1× | -0.8% |
ServiceNow's premium requires sustained growth above peers.
| RPO | $29.0bn |
| Current RPO | $13.2bn |
| Non-GAAP operating margin | 29.5% |
| H1 free cash flow | $2.3bn |
| FY subscription guide | $15.76–15.78bn |
AI contract value must grow roughly 50% from the Q2 run rate to reach the year-end target. Pricing pressure, stock compensation or weaker backlog would make the valuation premium harder to defend.
Sources: ServiceNow Q2 2026 results and investor relations; current market data timestamped above. Non-GAAP measures are management figures.
| Company | P/E | Move |
|---|---|---|
| Pfizer | 36.8× | -0.2% |
| J&J | 31.1× | +0.8% |
| Merck | 118.7× | -0.8% |
| Eli Lilly | 39.4× | -0.2% |
Pfizer trades near 9.6× the midpoint of adjusted 2026 EPS guidance. The trailing multiple is distorted by impairments.
| First-half dividends | $4.9bn |
| Internal R&D | $5.3bn |
| 2026 buybacks | $0 |
| Indicated yield | 6.15% |
| Cost savings by end-2026 | $5.7bn |
Core products must outrun a roughly $4 billion COVID franchise. Patent losses, pricing pressure and integration charges can absorb the benefit of launched-product growth.
Sources: Pfizer Q2 2026 release and investor relations; market data timestamped above. Guidance and non-GAAP measures are management figures.
The reported-margin marker sits below zero; restructuring created a 10-point gap versus the comparable measure.
| Metric | Value | Change |
|---|---|---|
| Net sales | €4.82B | +8% |
| AI & Cloud sales | €446M | +105% CC |
| AI & Cloud orders | ~€2.8B | Pipeline |
| Comparable operating profit | €434M | 9.0% margin |
| Reported operating result | −€50M | −1.0% margin |
| Restructuring charges | €390M | Cash burden |
| 2026 comparable operating profit | €2.1B–€2.6B |
| Management target | Somewhat above midpoint |
| Net cash + interest-bearing investments | €2.78B |
| Working-capital outflow | ~€1.15B |
| Trailing P/E screen | ~72× |
| Communications-industry average | ~34× |
Core test: AI revenue can support a rerating only if operating gains reach free cash flow.
Sources: Nokia Q2 and half-year 2026 report; MarketWatch price and volume; published valuation screen. Constant-currency growth is marked “CC.”
| June 30 cash + restricted cash + short-term investments | $1.4B |
|---|---|
| Q3 cash used for DZYNE and Cyberhawk | ≈$325M |
| Modeled remainder before other flows | ≈$1.08B |
| Execution checkpoint | Current evidence | What changes the thesis |
|---|---|---|
| Q3 revenue | $140M–$155M guide | Delivery timing and mix |
| Margins | 50.4% adjusted gross margin in Q2 | Operating leverage must offset integration costs |
| Profitability | Platform target: Q4 2026 | Sequential EBITDA improvement |
| M&A | Aran: ≈$33M for ≈$26M expected 2026 sales | Q3 closing and integration |
A 39% monthly rally meets high short interest and a slower sequential ARR build.
| Metric | Q1 FY2027 | Next test |
|---|---|---|
| Revenue | $418M · +17% YoY | $395M–$400M Q2 guide |
| ARR | $1.901B · +12% | $1.929B–$1.934B |
| Net new ARR | $49M | ≈$30.5M implied midpoint |
| Net retention | 109% | Stabilization or reacceleration |
| GAAP operating income | $28M | Profit durability |
| Adjusted free cash flow | $130M | Cash conversion |
High short interest can accelerate covering on a beat or deepen a reversal after a miss.
ARR growth below 12%, net retention slipping from 109%, weaker federal or international demand, and poor conversion of agentic pilots into production contracts would challenge the rerating.
Banco Azteca provides operating proof: 300+ automations across 8,800+ processes. It does not disclose UiPath contract value.
| Metric | Marvell | Reference |
|---|---|---|
| Forward P/E | 58.41× | Broadcom 32.15× |
| FY2027 EPS estimate | $4.20 | $4.04 three months ago |
| FY2028 EPS estimate | $6.69 | $6.13 three months ago |
| Ratings | 30 Buy · 7 Overweight | 6 Hold · 0 Sell |
| Target range | $211.97–$400 | Median $295 |
Beat: Revenue was $39M above prior guidance midpoint. Adjusted EPS of $0.94 topped the $0.93 consensus.
Guide: Q3 revenue midpoint implies about 15% sequential growth.
Disconnect: The Google agreement can support up to $120B of cumulative custom-product revenue, but the strongest contribution is not expected until fiscal 2029.
Friday's decline removed about $22.3B of equity value even as quarterly revenue grew 37%. The central question is timing: Marvell must convert its Google and other hyperscaler programs into revenue quickly enough to justify a forward earnings multiple roughly 82% above Broadcom's.
| Facility | Principal | Rate | Annual interest* |
|---|---|---|---|
| Microsoft GPUs | $3.6B | 6.0% | $216M |
| Mackenzie GPUs | $2.4B | 9.0% | $216M |
| Disclosed subtotal | $6.0B | — | $432M |
| Contracted ARR for 2026 capacity | $4.0B |
| Operating ARR at Aug. 26 | $1.0B |
| FY26 AI Cloud revenue | $128.8M |
| FY26 adjusted EBITDA | $245.7M |
| FY26 net loss | −$702.6M |
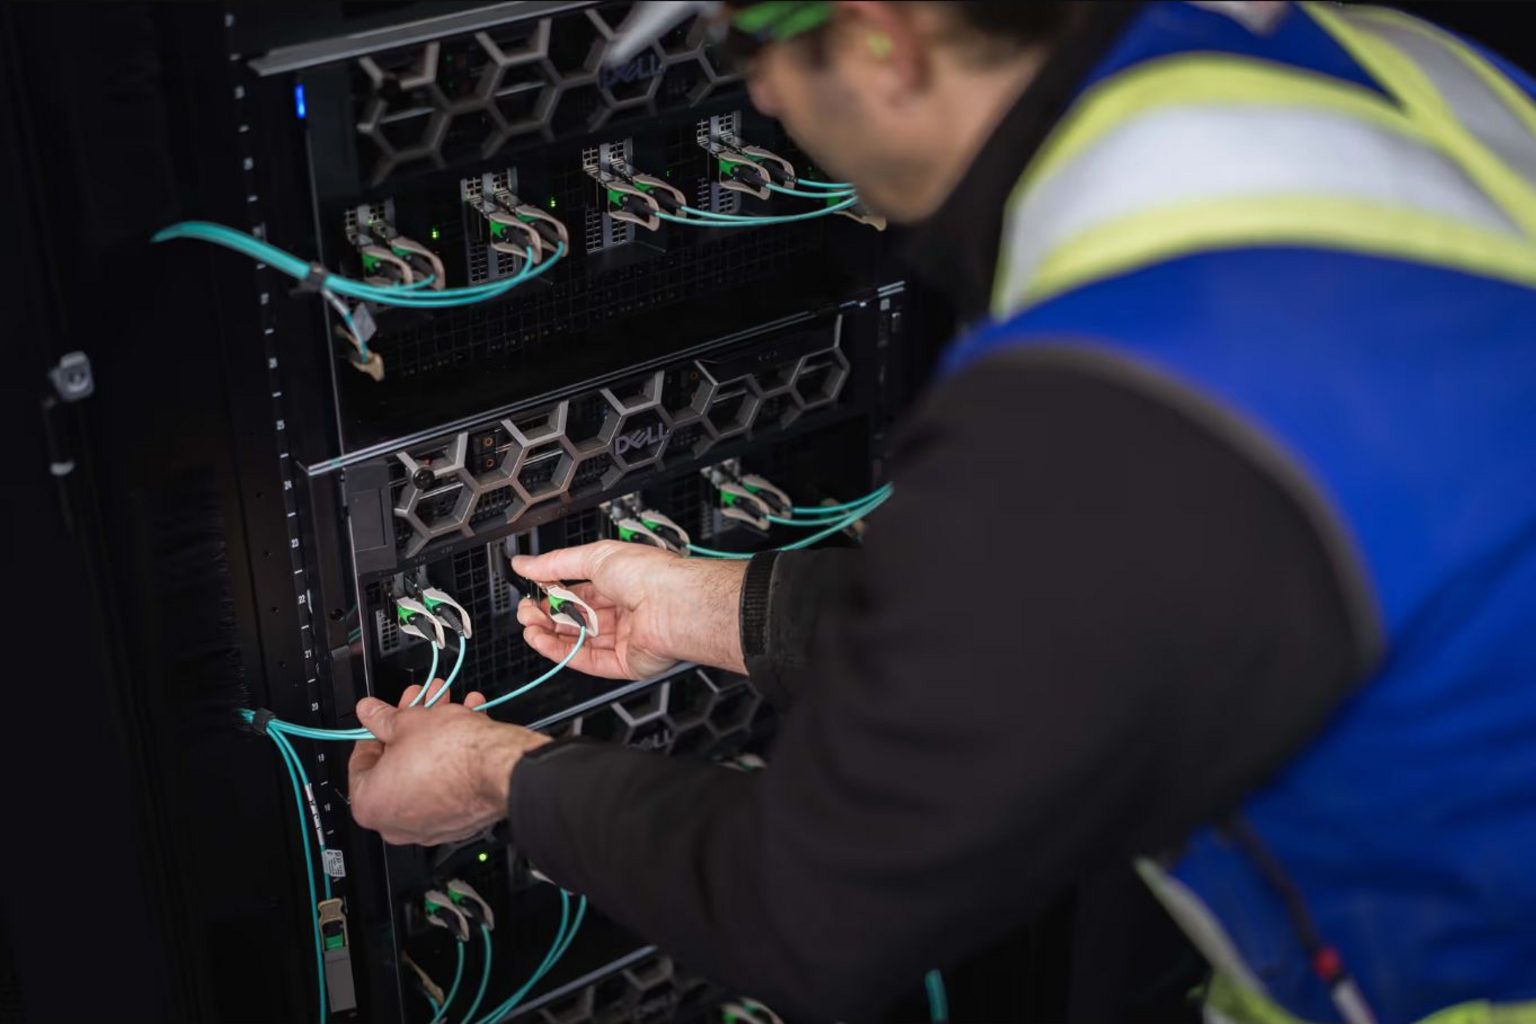
Horizon 2 is commissioning. Horizon 3–4 target Q4 2026 delivery. Customer acceptance turns contracted ARR into revenue; delays leave interest and construction costs running.
| Segment | Revenue | YoY |
|---|---|---|
| Connectivity | $4.291B | +66% |
| AI | $2.561B | +247% |
| Space | $0.962B | +29% |
| Total | $7.814B | +92% |
| AI capex | $15.828B |
| Connectivity capex | $1.367B |
| Space capex | $1.174B |
| Total | $18.369B |
| Adjusted EBITDA | $3.538B |
| Operating loss | −$143M |
| Net loss | −$541M |
| EPS | −$0.09 |
| Cash and securities | $100B |
| Backlog | $47.5B |
| IPO net proceeds | $85.7B |
| Annualized Q2 sales multiple | ≈59.6× |
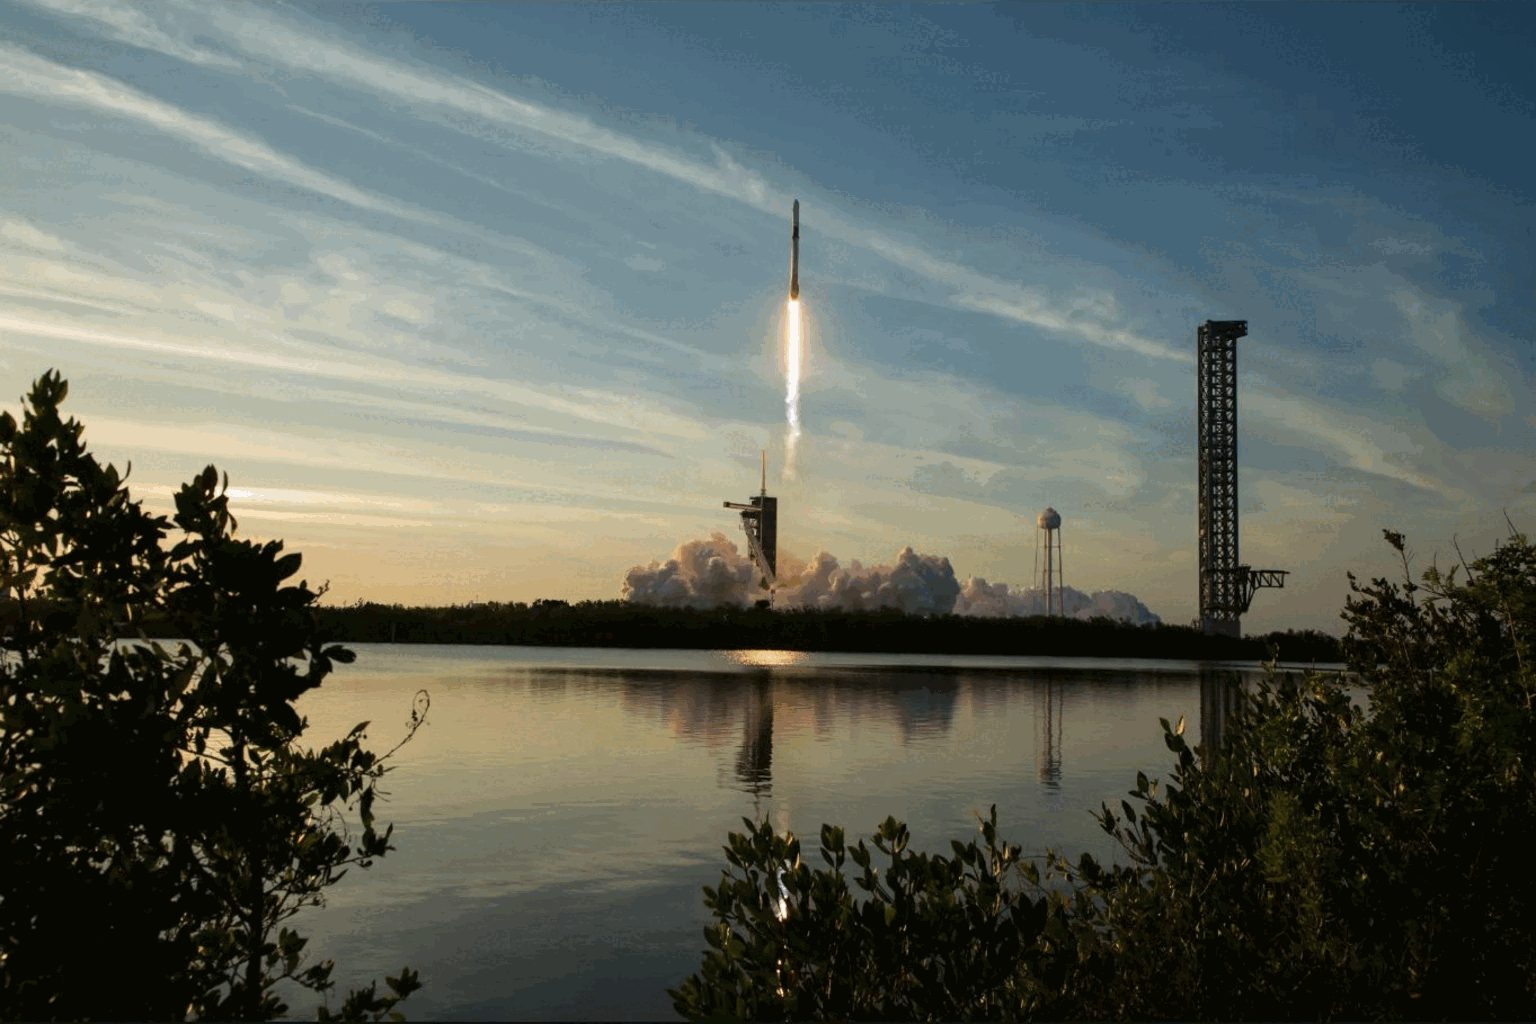
Connectivity generated $1.66B of operating income, while AI revenue surged and adjusted EBITDA turned positive. The valuation still assumes that Starlink cash flow can fund Starship and AI buildout without exhausting the $100B liquidity cushion.
Sources: SpaceX Q2 2026 results; Yahoo Finance; MarketWatch. Rounded figures. Informational only, not investment advice.
| Metric | Q2 2026 | YoY |
|---|---|---|
| Revenue | $16.1B | +25% |
| Data Center & AI | $6.3B | +59% |
| Client computing | $8.9B | +13% |
| Foundry* | $5.8B | +31% |
| GAAP gross margin | 40.4% |
| GAAP operating margin | 11.1% |
| Operating cash flow | $7.0B |
| GAAP net loss | −$11.0B |
| Base shares issued | 210.5M |
| Estimated dilution | ≈4.0% |
| Underwriter option | 31.6M |
| Net proceeds | ≈$19.7B |
Friday's rate-driven technology selloff erased about $13.9 billion and left Intel below its financing price. The operating rebound is substantial: revenue grew 25%, data-center sales rose 59% and operating margin turned positive. The next rerating depends on converting roughly $19.7 billion of new capital into durable foundry utilization, margins and free cash flow without further dilution.
Sources: Intel Q2 2026 results; Intel common-stock offering release; Yahoo Finance market data; MarketBeat analyst consensus. Figures may be rounded. This dashboard is informational, not investment advice.
The target gap is meaningful, but it depends on wildfire and financing risks declining—not only on delivering guided EPS.
| Signal | Reading | Interpretation |
|---|---|---|
| Valuation | ≈10.1× guided core EPS | Low multiple reflects liability and capital risk. |
| Earnings | Q2 core EPS +29% year over year | Utility operations are improving. |
| Liquidity access | $4.4B utility debt financing in H1 | Funding is available, but leverage raises sensitivity. |
| Policy | Liability proposal rejected | Near-term rerating path weakened. |
| Trading | 5.1× average volume | Policy news triggered a broad repricing. |
Bull case: EPS deliveryBull case: revised liability reformBear case: adverse fire claimsBear case: higher capital costs

Season 2 engagement and monetization dashboard
Q2 2026; Netflix investor relations.
| Season 2 premiere | September 17, 2026 |
|---|---|
| Season 1 debut | April 23, 2026 |
| Turnaround | Under five months |
| 2026 ad outlook | About $3.0B |
| 2026 FCF outlook | About $12.5B |
A familiar franchise can lower discovery and marketing friction. The financial test is whether September’s new episodes lift retention and ad inventory beyond launch week while preserving a 33.4% operating margin.
Product timing: Netflix Tudum, Aug. 24, 2026.
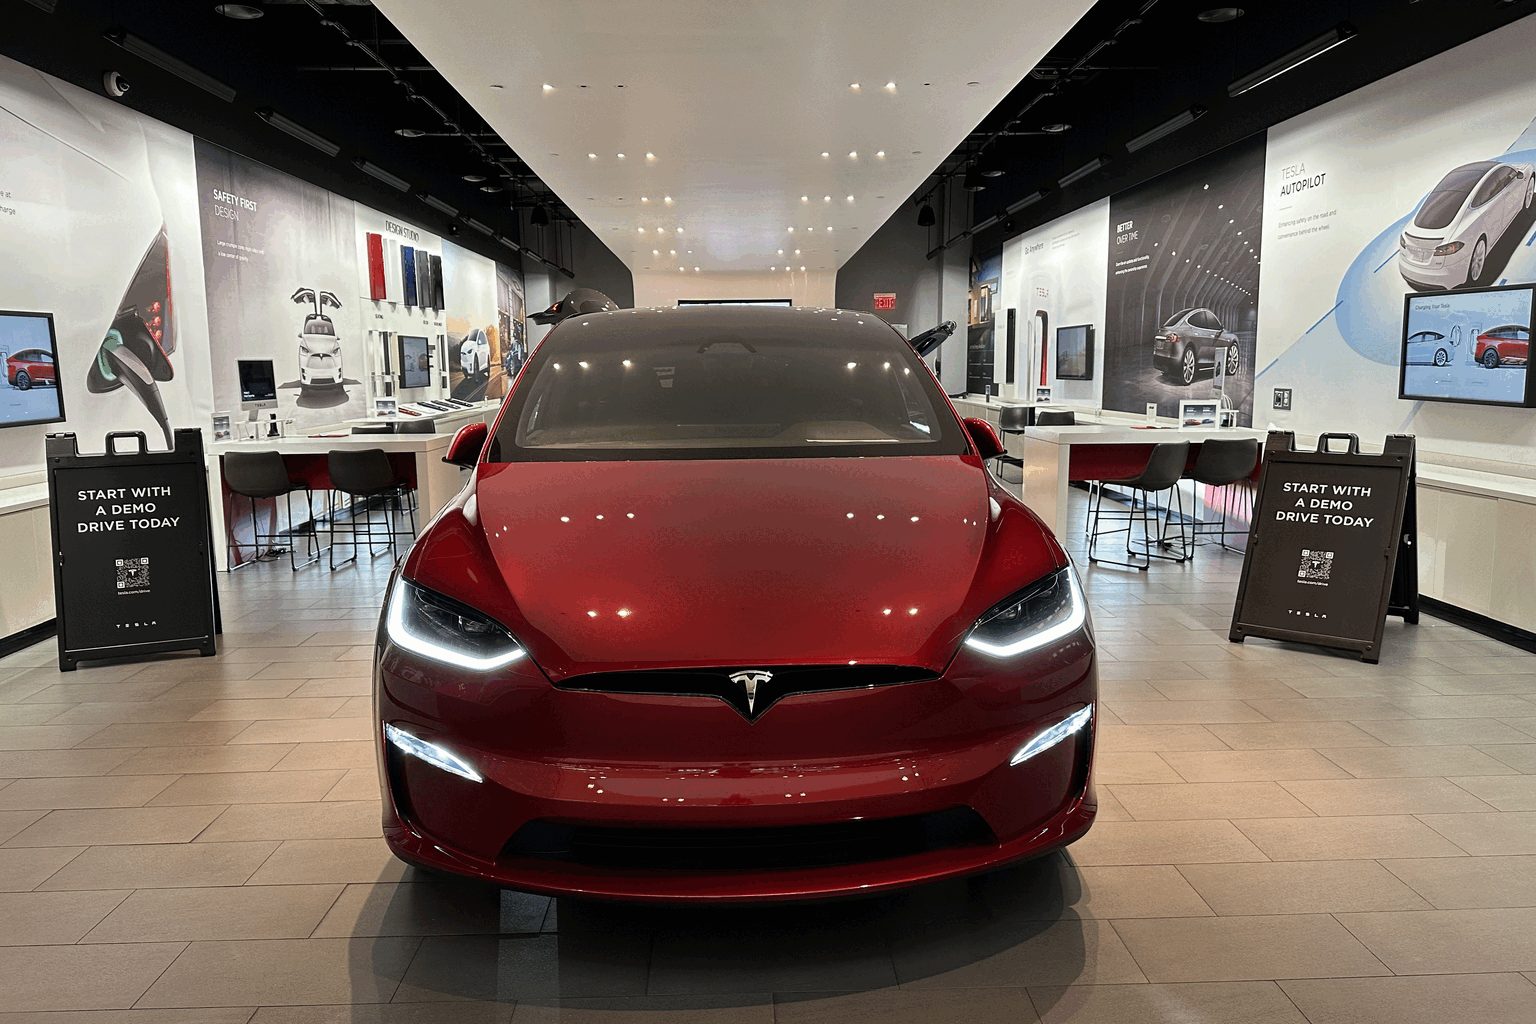
Price premium meets margin pressure
Q2 ended June 30, 2026; Tesla shareholder update.
| View | Count / target | Signal |
|---|---|---|
| Buy | 11 analysts | Supportive |
| Hold | 14 analysts | Largest group |
| Sell | 3 analysts | Cautious |
| Average target | $385.05 | +10.4% |
| Target range | $130–$505 | Wide dispersion |
Google Finance snapshot, Aug. 28, 2026.
| Cybertruck base trim | $74,990 |
|---|---|
| Premium AWD trim | $84,990 |
| Recent increase | +$5,000 each |
| H1 U.S. Cybertruck sales | 7,263 est. |
| Year-on-year change | -32.2% |
Prices reported Aug. 26; sales estimate from Cox Automotive.
Tesla lost about $19 billion of market value on Friday. Its balance sheet funds autonomy, robotics and energy expansion, but a 323.95× earnings multiple leaves little room for delays while operating margin sits at 1.4%.
Cloud plus core data center supplied 61% of revenue.
| Metric | Q3 2026 |
|---|---|
| Operating cash flow | $25.39B |
| Capital expenditure | $7.10B |
| Adjusted free cash flow | $18.30B |
| Cash and investments | $30.20B |
| Signal | Value |
|---|---|
| Buy / Hold / Sell | 30 / 1 / 0 |
| Average target | $1,556.55 |
| Implied upside | 66.9% |
| Target range | $1,100–$2,200 |
| Test | Current evidence | Investor read-through |
|---|---|---|
| Pricing | 86% Q4 gross-margin guide | Durability matters more than another headline beat |
| AI mix | HBM4 shipping at volume | Supports high-margin data-center concentration |
| Supply | Rivals plan major capacity | Raises medium-term cycle risk |
| Cash | $18.3B Q3 adjusted FCF | Funds expansion without near-term balance-sheet strain |
● Faster rival capacity additions
● AI customer inventory correction
● Taiwan labor disruption
● HBM qualification or yield delays
Next confirmed catalyst: fiscal Q4 results, Sept. 30 after the U.S. close.
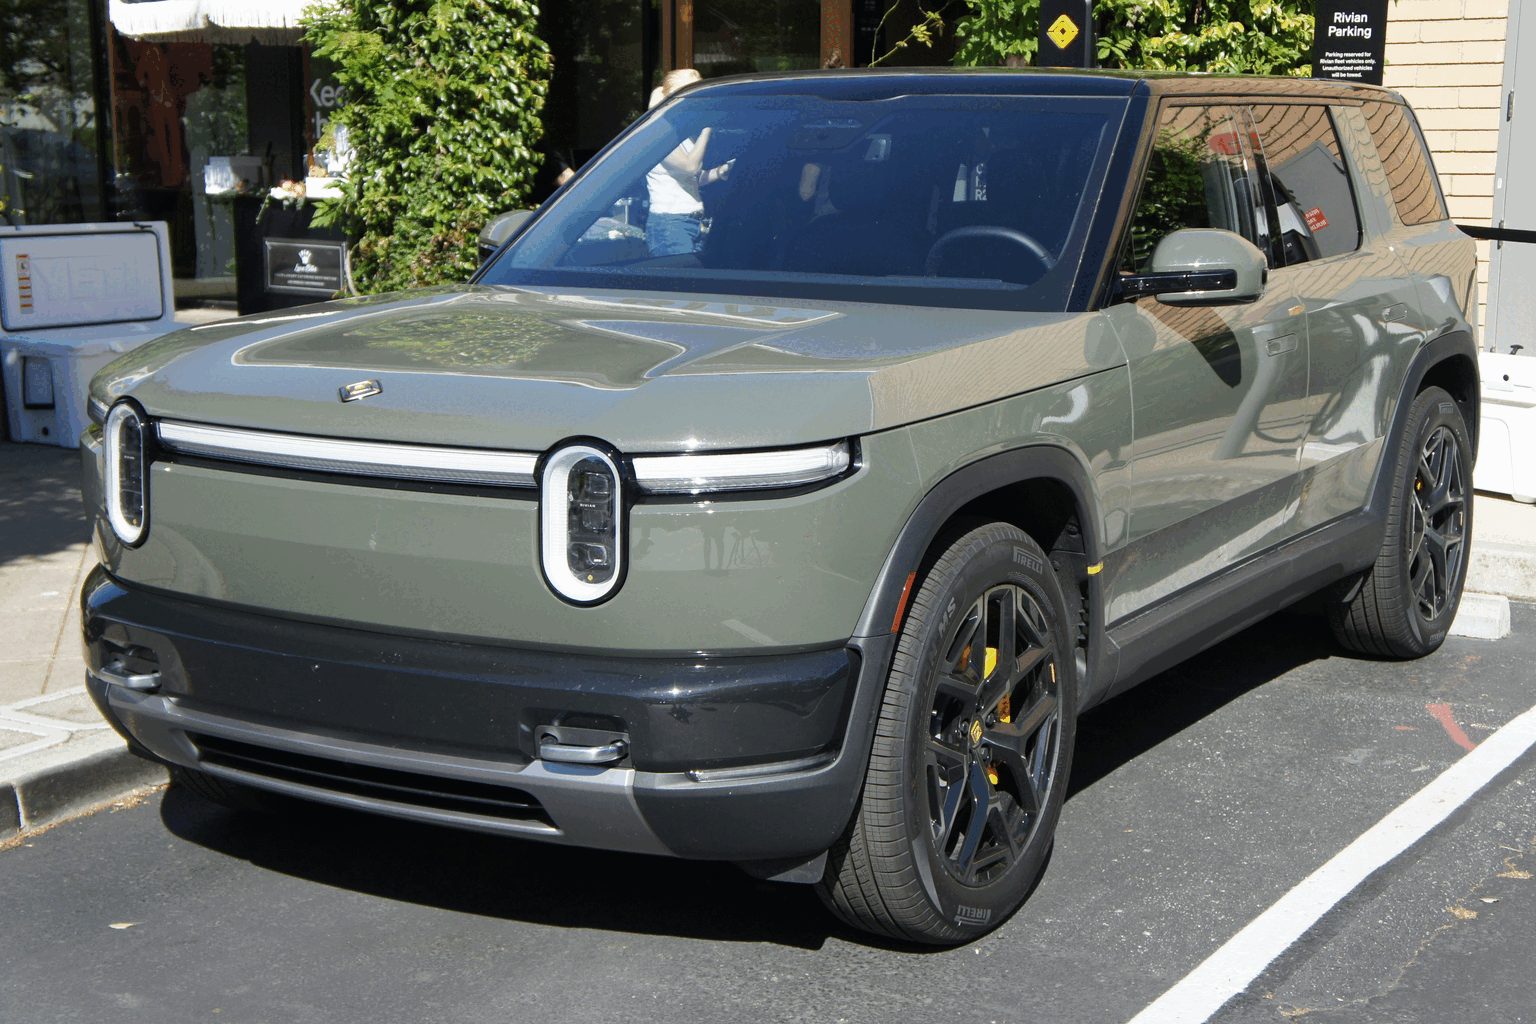
| Metric | Q2 '26 | Q2 '25 |
|---|---|---|
| Revenue | $1.66B | $1.30B |
| Gross profit | $179M | -$206M |
| Automotive gross profit | -$36M | -$335M |
| Adjusted EBITDA | -$379M | -$667M |
| Deliveries | 12,194 | 10,661 |
Quarter ended June 30, 2026; results released July 30.
$215M gross profit on $515M revenue.
Automotive gross margin-3%-$36M gross profit on $1.14B revenue.
| Annualized Q2 revenue | $6.63B |
| Price / run-rate sales | ≈3.5× |
| Cash + short-term investments | $5.31B |
| Cash / market value | ≈23% |
| IBES analyst consensus | Hold |
Market ratios use Aug. 28 close; analyst consensus dated Aug. 19, 2026.
Claire McDonough remains CFO through October. Rivian's successor must finance the R2 ramp while automotive gross margin turns positive.
2026 delivery guide: 65,000–70,000.
Signal to watch: Automotive gross profit per vehicle, not software profit alone.
R2 delays, supplier costs, weaker demand and financing needs could slow margin recovery. High short interest and a 1.94 beta can magnify price swings.
Sources: Rivian Q2 2026 results; Reuters, Aug. 27; MarketWatch, Aug. 28; Reuters/IBES, Aug. 19.

| Metric | Reading |
|---|---|
| Market capitalization | $2.87T |
| Trailing P/E | 21.3× |
| Average target | $327.67 |
| Target upside | 23.0% |
| Evercore target | $355.00 |
| Ratings | 59 Buy · 2 Hold · 0 Sell |
| Friday volume | 49.55M |
| 3-month average | 49.13M |
| View | Count | Share |
|---|---|---|
| Buy / Overweight | 19 | |
| Hold | 6 | |
| Underweight / Sell | 6 |
| Period | EPS estimate | Price / EPS |
|---|---|---|
| Q3 2026 | $0.07 | Estimate cut 22% in 3 months |
| FY 2026 | $0.39 | 26.2x |
| FY 2027 | $0.47 | 21.7x |
| Horizon | Return |
|---|---|
| 5 days | +2.51% |
| 1 month | +9.08% |
| 3 months | −37.17% |
| Year to date | +57.81% |
| 1 year | +137.44% |
Backlog growth is strong. Loss conversion is the test.
Market data: August 28, 2026, 16:00 EDT · After-hours: 19:59 EDT · Dashboard updated August 30, 2026, 09:12 EDT
Friday's fall exceeded the S&P 500's 0.25% decline and the industrial-goods group's 1.26% drop.
$757M equals 1.41× the $537.5M midpoint of 2026 revenue guidance.
| Metric | Q2 2026 | Q1 2026 |
|---|---|---|
| Revenue | $83.8M | $50.1M |
| Gross margin | 43.1% | 49.2% |
| Adjusted EBITDA | −$50.6M | −$10.9M |
| Cash operating expense | $93.3M | $36.9M |
| Net income / loss | −$89.7M | $361.2M |
| Market cap / FY26 revenue midpoint | 8.4× |
| FactSet rating mix | 10 Buy · 0 Hold · 0 Sell |
| Average target | $19.42 · 146% above close |
| Target range | $13–$25 |
| Next expected report | November 16, 2026 |
Ratings and targets shown by WSJ/FactSet on August 28, 2026.
Cash, restricted cash and short-term investments totaled $1.4B at June 30. Ondas then used about $325M to close DZYNE and Cyberhawk. The remaining cash balance cannot be derived precisely without later operating and investing flows.
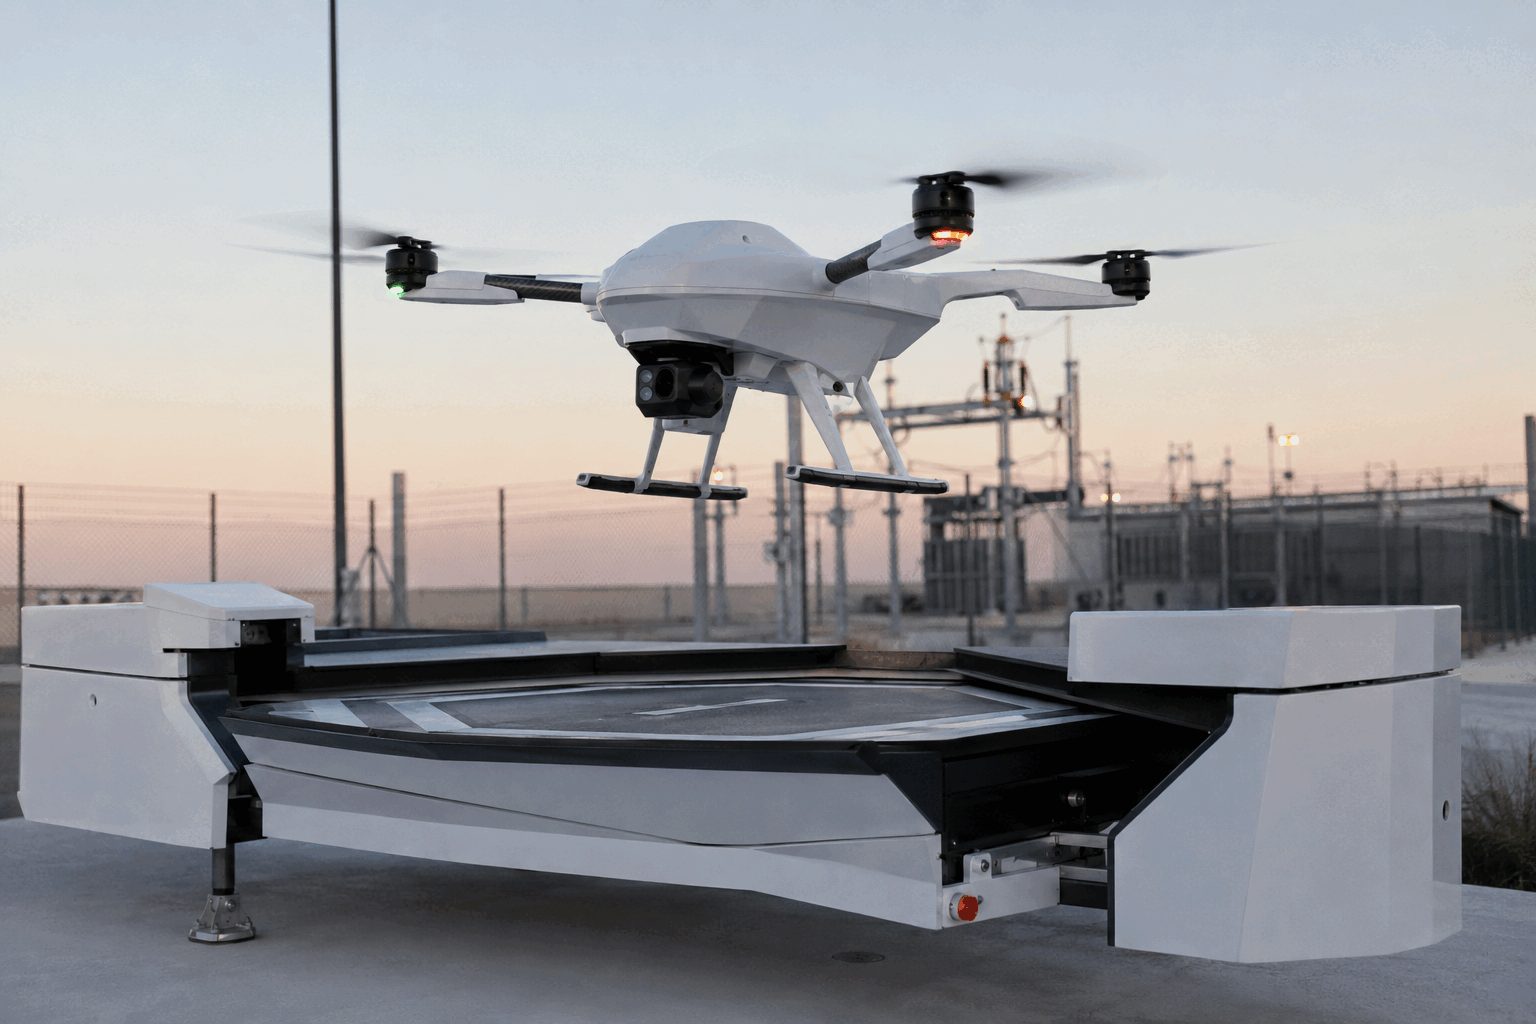
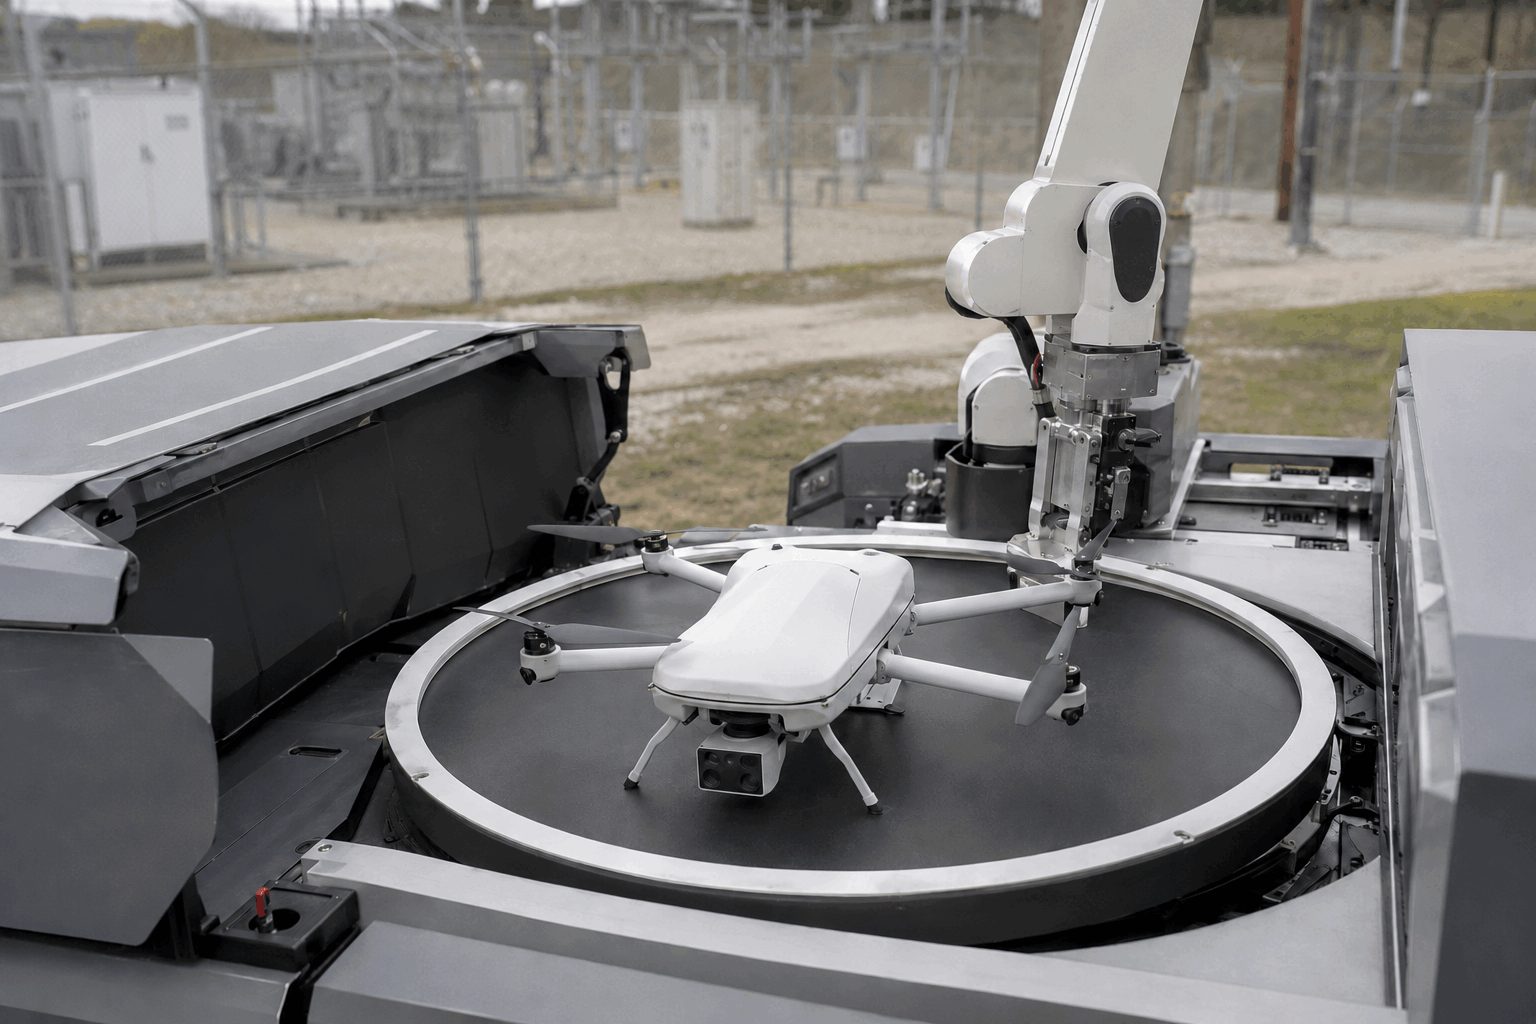
The stock assigns substantial value to the $757M backlog and defense-drone platform. Friday's decline says investors want proof that volume deliveries can lift gross profit faster than cash operating expense.
Backlog timing, contract milestones, integration costs and margin mix can shift quarterly results. Acquisitions may consume more cash. Equity issuance could dilute the per-share backlog claim.