
Investor Dashboard

The New Zealand dollar slipped roughly 1.1% on Wednesday despite a rate hike from the Reserve Bank. By 17:04 NZST it was trading near US$0.5830, down from US$0.5896 recorded just ahead of the announcement. Market moves indicated guidance took precedence over the anticipated rate increase.
Category hubBreaking
Follow the latest TechStock² reporting, investor analysis and material developments for Breaking in one continuously updated topic hub.
U.S. dollars per New Zealand dollar, September 2
Annual change, June 2026 quarter; scale runs to 6%
Sources: RBNZ and RNZ/Stats NZ.
September 2 decision and forward-looking policy split
Consensus to lift the OCR to 2.75%
4 upside · 2 balanced
Path remains conditional, not pre-set
Source: RBNZ meeting record and decision calendar.
Daily closes in U.S. dollars; the final point is Tuesday after-hours.
As of . Sources: Google Finance and Yahoo Finance. Change from August 25 close to September 1 close: -1.7%.
Netflix global non-English film chart, August 24–30, 2026.
Source: Netflix Top 10. Views equal total hours watched divided by runtime.
GAAP amounts as a share of $12.56 billion revenue.
Source: Netflix Form 10-Q for the quarter ended June 30, 2026. Percentages may not sum exactly because of rounding.
Ratings and 12-month targets reported by Google Finance.
As of September 1, 2026. The $95.46 average implies 18.1% upside; the range spans -13.4% to +67.1% versus the close.
U.S. dollars per share; company release issued at 17:32 EDT
As of . Source: Yahoo Finance; five-minute observations, calculations by TS2.
Supporting an offshore-wind development project.
Performing commercial offshore-platform inspection.
Utilization: 2 of 2 systems deployedProject prices, duration and expected revenue were not disclosed. Other submitted proposals remain unawarded.
Status on September 1, 2026. Source: Nauticus Robotics.
Millions of dollars; after-hours equity value uses $1.01 and 7,471,960 shares
Sources: Nauticus Form 10-Q, Yahoo Finance and company results. Equity value is an estimate; TS2 calculations.
Selected 15-minute prices, U.S. dollars
As of . Source: Yahoo Finance market data. The dashed segment is after-hours trading.
Quarter ended June 30, 2026. Source: Axon.
Ratings from the past three months; price-target summary viewed September 1, 2026. Source: Google Finance.
September 1, 2026 close. Sources: Yahoo Finance market data and Associated Press.
As of
Unit: U.S. dollars per share. Source: Yahoo Finance, 15-minute observations with the latest extended-session print.
Three months ended June 30; U.S. dollars in millions
Adjusted EBITDA and free cash flow are non-GAAP measures. Source: Snap Q2 2026 results.
Q2 2026 daily active users and quarterly average revenue per user
DAU −7% · ARPU +23% year over year
DAU −2% · ARPU +36% year over year
DAU +12% · ARPU +4% year over year
Rest of World held 3.3 times North America’s daily users, but its ARPU was one-tenth as large.
Percentages may not sum due to rounding. Source: Snap Q2 2026 Form 10-Q.
· U.S. dollars
Source: Yahoo Finance one-minute market data. Extended-hours prints can be thin and may change before the next open.
Company guidance versus the prior quarter; U.S. dollars
Source: HPE fiscal second-quarter release, June 1, 2026. Midpoint growth calculated from reported figures.
Fiscal Q2 FY2026 year-on-year revenue growth and operating margin
Source: HPE fiscal second-quarter release. Bar length compares reported growth rates, not segment size.
Sixteen ratings published during the past three months
Source: Google Finance analyst compilation, accessed September 1, 2026.
Sources: Nasdaq SPY, QQQ, DIA and IWM quote records. Values reflect the latest reported trades at 17:01 EDT.
Selected S&P 500 sector ETF returns at the 16:00 EDT close; bar lengths show absolute move.
Source: Nasdaq closing quotes for XLE, XLU, XLV, XLI, XLK and XLY, September 1, 2026.
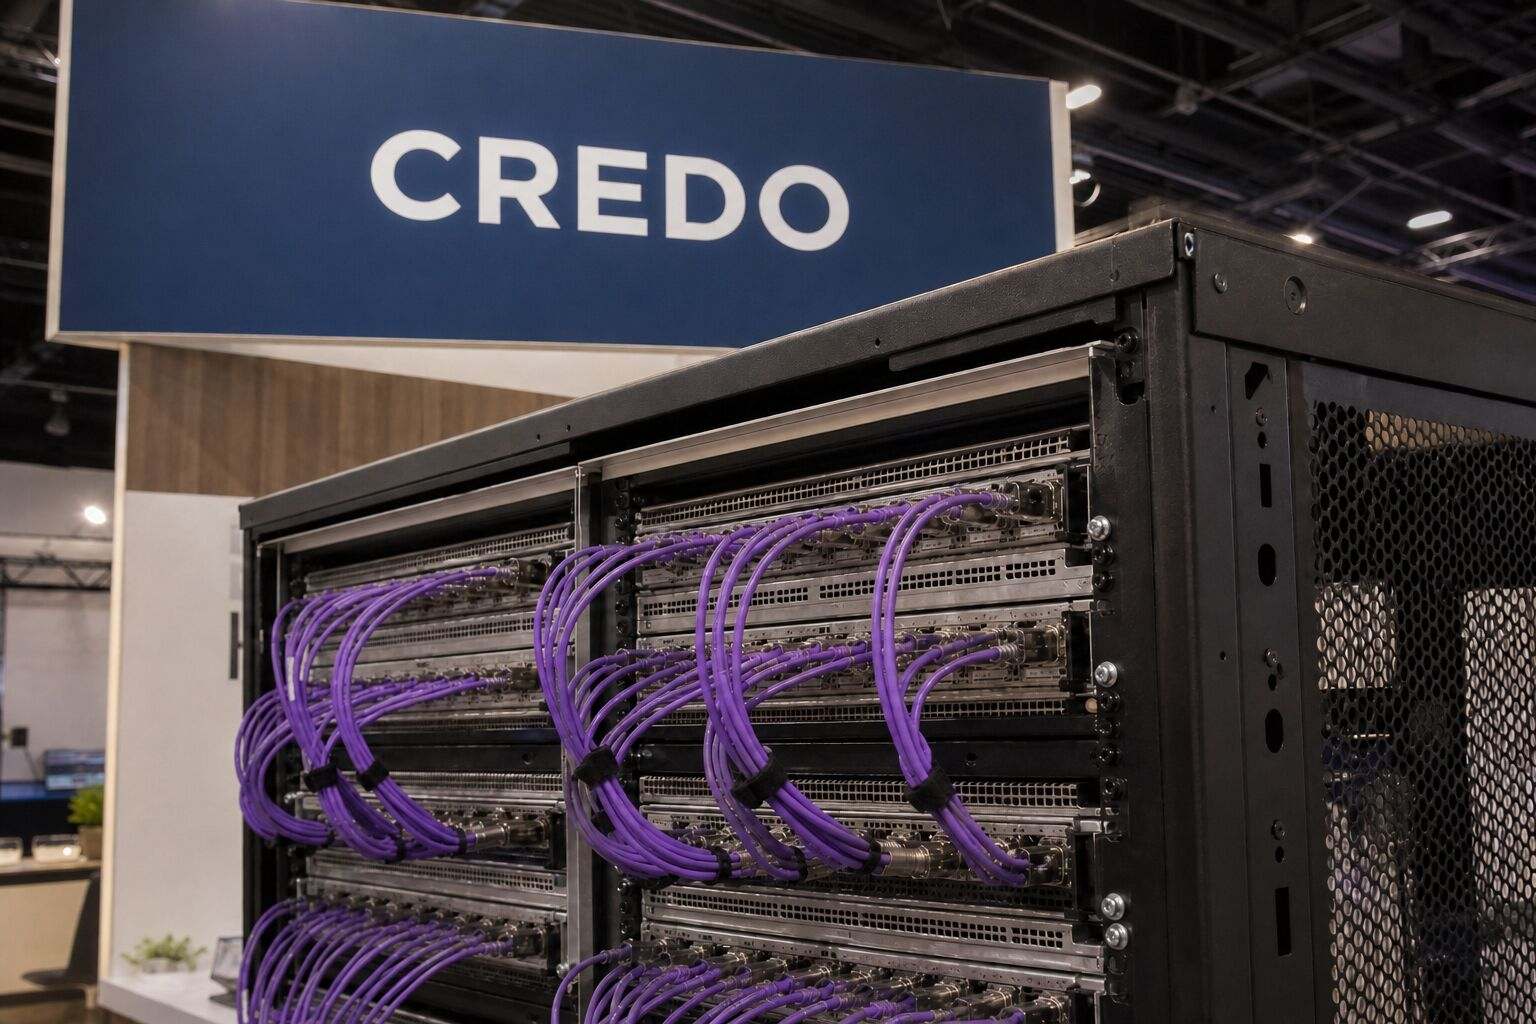
Sources: Nasdaq after-hours quote records for DELL, MDB, CRDO and PANW. Latest trades were reported from 17:01 to 17:02 EDT.
USD per share; regular close through latest reported trade
As of . Sources: Nasdaq closing and latest trade; Yahoo Finance one-minute extended-hours bars.
Year-over-year growth unless noted; fiscal second quarter ended July 31, 2026
Source: MongoDB fiscal Q2 2027 release. Non-GAAP measures exclude specified items.
Midpoints of fiscal 2027 guidance; current versus May 28 outlook
Sources: current company guidance and May 28 SEC exhibit. Midpoints and percentage changes are calculated.
USD per share ·
Source: Google Finance. After-hours trading is less liquid and can change quickly.
USD millions · fiscal quarters
Guidance uses the $525–535 million midpoint. Source: Credo SEC filing, September 1, 2026.
GAAP gross margin · basis-point change shown versus the prior period
Source: Credo SEC filing. Guidance is preliminary and forward-looking.
Ratings and 12-month targets published before the latest results
Source: Google Finance, 15 analysts over the prior three months. Targets predate this earnings release and may change.
U.S. dollars per share; regular session
As of . Source: Yahoo Finance. Five-minute observations; final point is the latest trade.
Regular-session change at 14:50 EDT
Source: Yahoo Finance quote pages for SN, WHR, FBIN, MHK and S&P 500. As of September 1, 2026, 14:50 EDT.
Billions of U.S. dollars
Gross debt equals about 2.9 times implied equity value.
Sources: Whirlpool June 30 Form 10-Q and 2026 outlook; Yahoo Finance price at September 1, 2026, 14:50 EDT. Equity value uses 65 million June shares. Net debt subtracts $1.239 billion cash. TS2 calculations.
Nasdaq price in U.S. dollars. As of .
Source: Yahoo Finance. Five-minute closes; low and high are session range markers.
Price divided by consensus forward earnings, as of September 1, 2026, 13:57 EDT.
Source: Yahoo Finance. Forward estimates can change.
Second-quarter 2026 segment revenue and year-over-year change.
Source: Intel. Segment revenue includes intersegment sales.
Hourly samples from regular-session five-minute data, U.S. dollars
Change from August 31 close; longer bars show larger declines
Second quarter, percent of segment revenue
The share illustration is a scale comparison, not an issuance forecast
Ford stock slides from the opening hour
NYSE price in dollars; previous close $13.94
As of . Five-minute observations; source: Yahoo Finance.
Commercial vehicles still carry Ford’s profit
Second-quarter 2026 segment EBIT, except Ford Credit pre-tax earnings; $ billions
Reported July 28, 2026. Source: Ford second-quarter results filed with the SEC.
Raised guidance still carries a large EV burden
Ford full-year 2026 outlook; company-adjusted measures
Scale check: the planned Model e loss is about 62% of the adjusted free-cash-flow midpoint. This is a magnitude comparison, not an accounting bridge.
Guidance issued July 28, 2026. Source: Ford’s SEC-filed earnings release.
Change from Monday's close. Snapshot: .
Source: Associated Press market update. Figures are snapshots, not live prices.
Morning figures reported September 1; checked at 09:54 EDT.
Source: Associated Press. Basis point change compares the 10-year yield with late Friday.
Decliners per advancer at the August 31 close, 16:00 EDT.
Total U.S. share volume was 15.65 billion, against a 15.58 billion 20-session average. Source: Yahoo Finance/Zacks market data.
Percent yield;
Source: TradingView. Streaming yield snapshot collected at the time shown.
Yield and move from the prior market reference at
Source: TradingView market snapshots for two-year, 10-year and 30-year yields. Bars use a 0%–6% scale.
Market move at
Source: TradingView snapshots for NQ futures, ES futures and DXY. Futures data were delayed by 10 minutes. Bars use a 1.5% absolute-move scale.
Full-time employees; scenario is illustrative, not company guidance
Sources: Oracle 2026 Form 10-K; Moneycontrol report. The final card assumes all reported cuts are incremental.
Oracle fiscal 2026 actuals and fiscal 2027 financing expectation, $ billions
Capital spending equals operating cash flow less free cash flow. Funding is Oracle's stated debt-and-equity expectation. Source: Oracle FY2026 results.
Price in pence. Snapshot at .
Source: Yahoo Finance, five-minute LSE data. Values are fixed to the stated timestamp.
Estimated equity-value loss and 2026 company guidance, £ billions.
Sources: Yahoo Finance, Google Finance share count, and Rolls-Royce guidance. Equity-value loss is an estimate.
Underlying operating margin, first half, percentage points.
Source: Rolls-Royce 2026 half-year results.
U.S. dollars per share; premarket trades shown at five-minute intervals
Total net sales: $109.42 billion; quarter ended June 27, 2026
Applied to the latest quarterly iPhone revenue base of $54.252 billion
Delivery Hero spread, funding load and earnings capacity
| Metric | Level | YoY |
|---|---|---|
| Trips | 3.9B | +18% |
| Gross bookings | $58.0B | +24% |
| Revenue | $14.2B | +12% |
| GAAP operating income | $1.9B | +30% |
| Adjusted EBITDA | $2.8B | +33% |
| Free cash flow | $2.8B | quarter |
The consolidated $179 million profit still depends on software and services.
| Measure | Q2 2025 | Q2 2026 | Change |
|---|---|---|---|
| Production | 5,979 | 12,613 | +111% |
| Deliveries | 10,661 | 12,194 | +14% |
| Automotive revenue | $927M | $1.143B | +23% |
| Software revenue | $376M | $515M | +37% |
| Net loss | −$1.115B | −$837M | Improved $278M |
| Measure | Value | Context |
|---|---|---|
| June 30 liquidity | $5.846B | −$742M from December |
| H1 capital spending | $734M | Normal plant and platforms |
| July equity raise | ≈$1.3B | 86.25M shares at $15.50 |
| April VW funding | $1.0B | ≈63M shares at $15.90 |
| R2 ramp cost | ≈$100M | Incremental Q2 cost |
| Market value | $23.27B |
| 52-week range | $12.39–$22.69 |
| Average analyst target | $19.23 |
| Target range | $13–$25 |
| Implied upside to average | 20.5% |
High short interest and above-average volume can magnify R2 news.
Watch first: automotive gross profit per vehicle as R2 volume rises.
Cash test: inventory and deferred-revenue swings must normalize.
Valuation test: $15.50 is the fresh financing anchor.
Risk: launch quality, warranty costs, demand and tariffs can delay margin gains.